2021-11-01
...
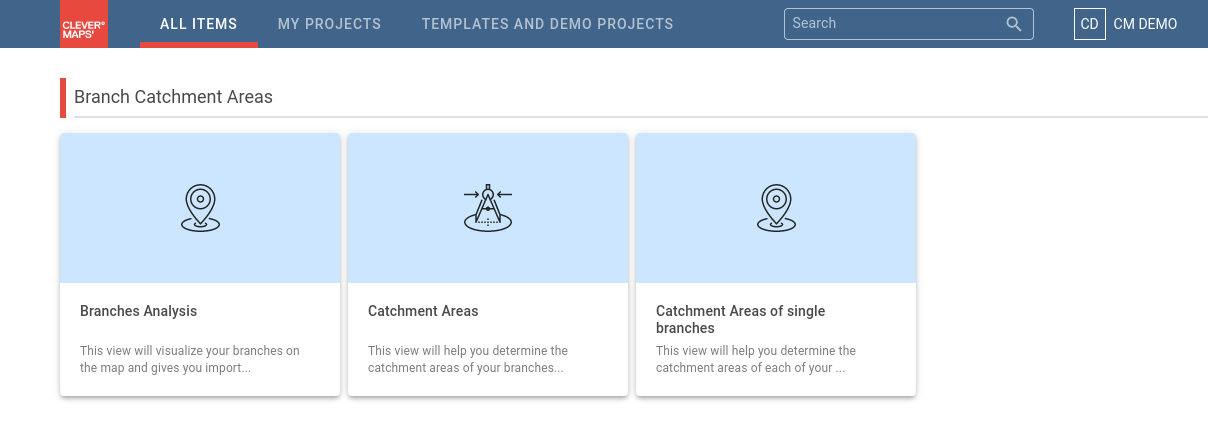
UI improvements of a Project list page
Unified a top bar for All Items, My Projects and Template and Demo Projects
Moved Search bar

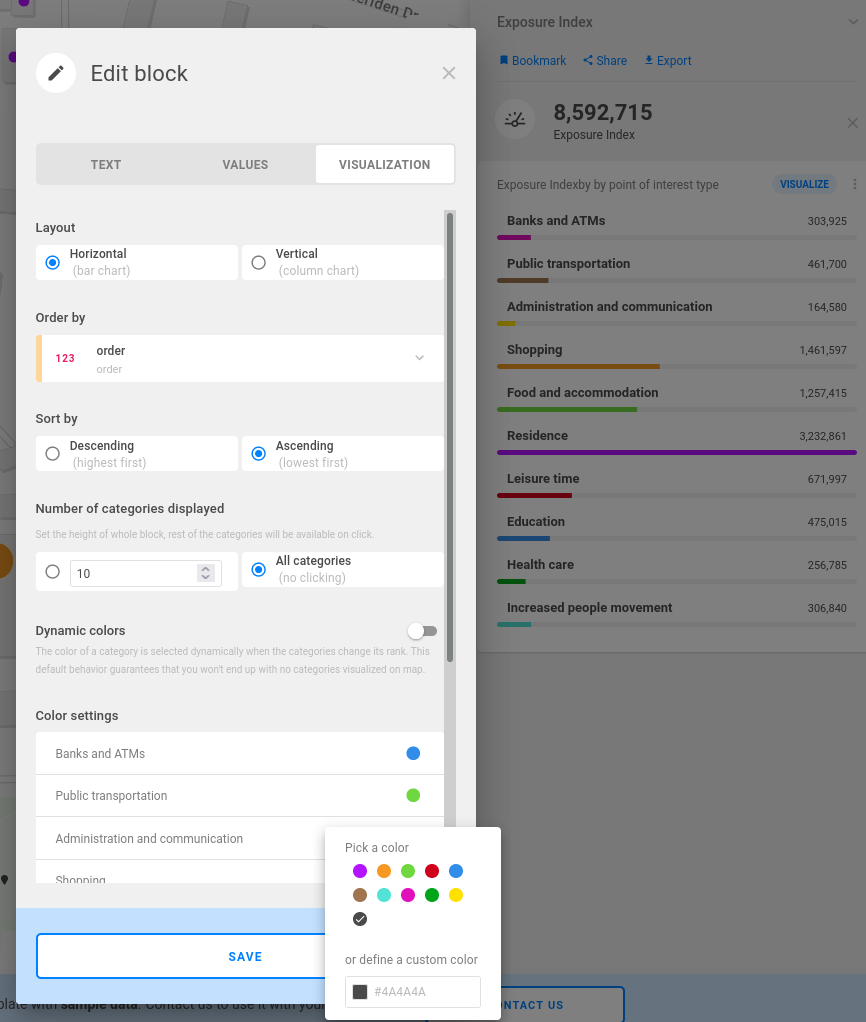
Set dynamic colors in categories
Dynamic colors as set a default colors when switching off the dynamic model
...
We have released a new version 1.5.2 of CLI tool CleverMaps Shell.
1.5.2
Fixed `importProject
importProject --prefix`prefixthat overrides metadata objectsAdded support for metric references
Reviewed help messages for all commands
Removed command alias `import`
import, use `importProject`importProjectcommand insteadAdded a new command `cloneProject`
cloneProjectfor server-side project clonning
...
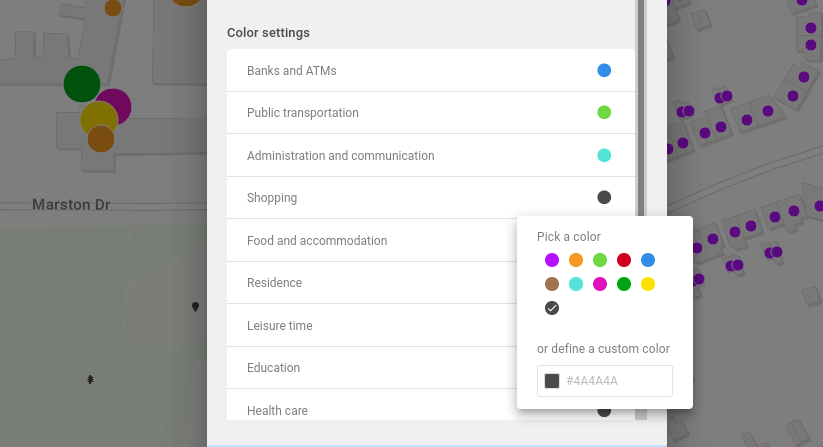
Allows to set categories colors from UI
Users can set a custom colors for each attribute values on UI
A same color can be now set to multiple attribute values


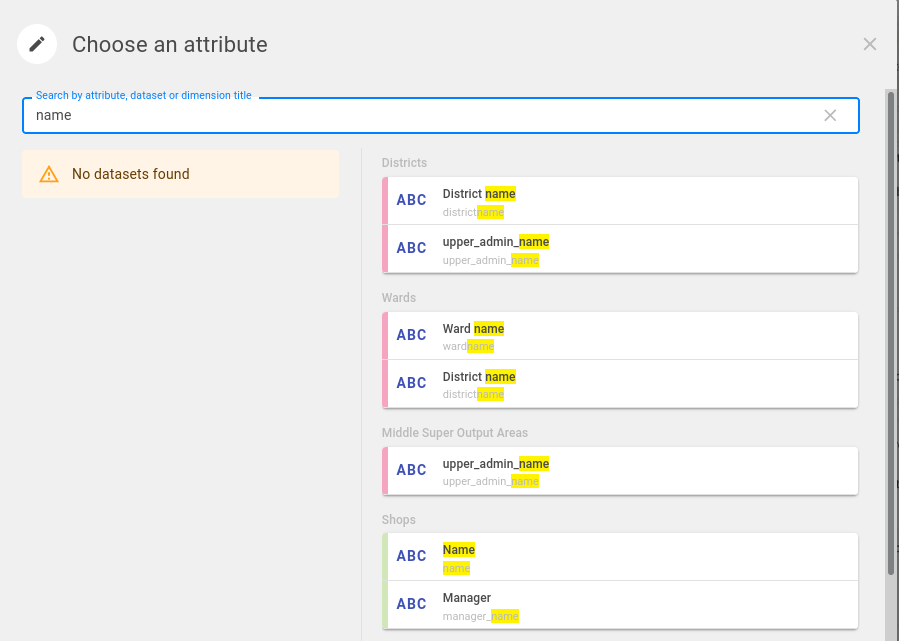
Added searching bar in modal of editing categories block
User can use full text search for find attributes in data model when editing Categories block.

Bugfixes
Fixes long project titles wrapping in left menu
Markers were not properly showed on map during the first map load
...
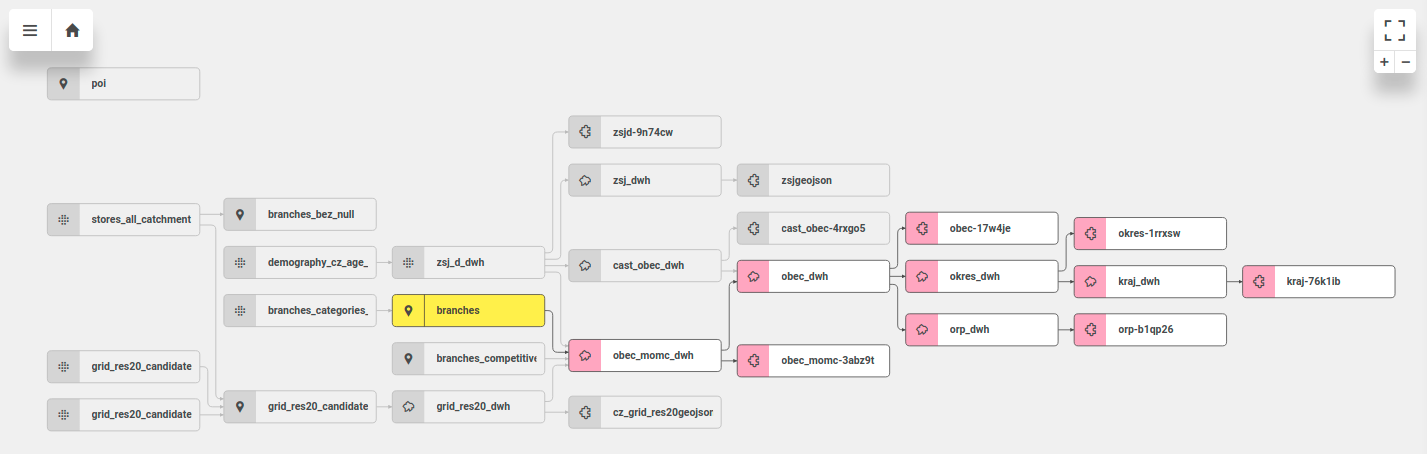
We have improved user interaction with Data model schema. You can use it in similar way as you use our map – mouse scroll works for zooming in or out and dragging can be used to pan the schema.
Relations between datasets in the schema are interactive. In case you select or hover some dataset, all related links and datasets remain active, others are muted. It helps you find the relations in large data models.
There is a new block Data Load History on the detail of dataset. It is available for administrators of the project. This gives you quick summary of all data modifications in the project. You can see when it happened and who made the change.
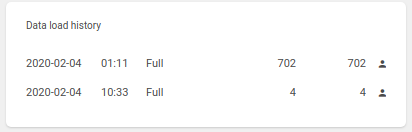
Date of load, time, type (Incremental or Full), count of records added, total count of records, user (details on hover)
You can preview the content of your datasets in with Data preview feature. You can enter this preview in dataset detail in the bottom of the Overview block.
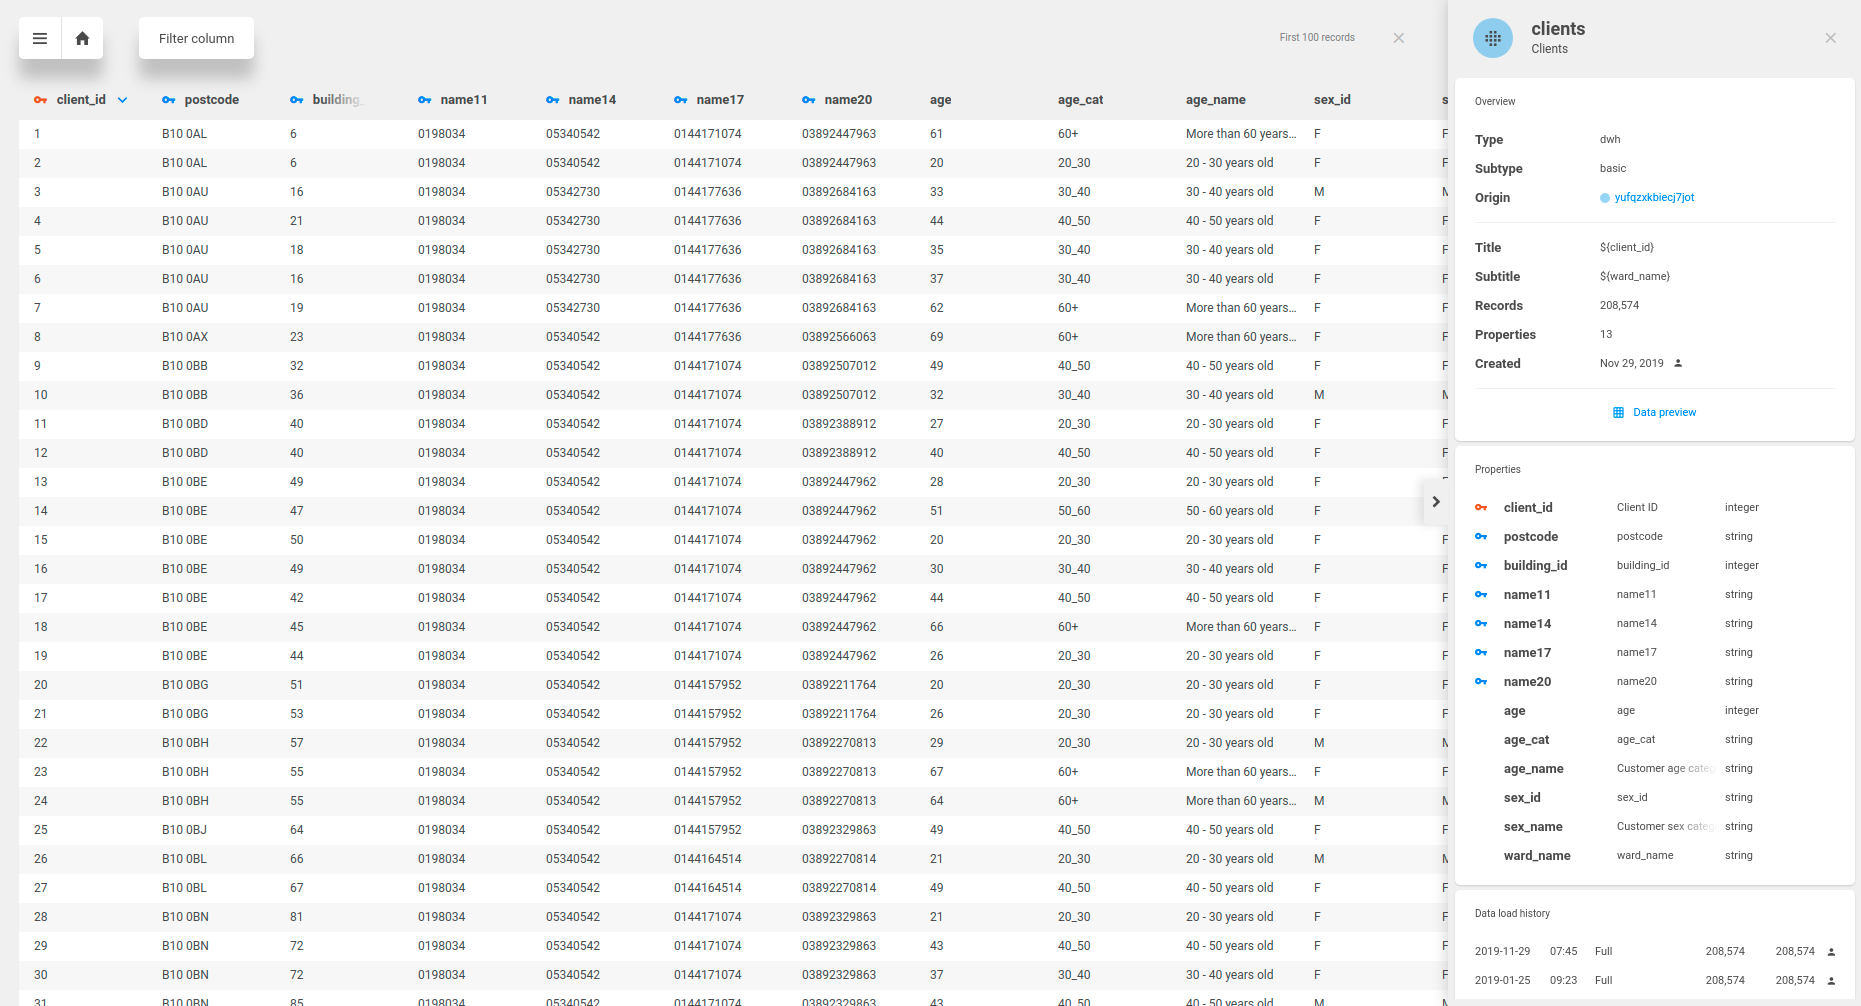
It is possible to sort the records by any column, filter records by property value with equality operator or easily go to linked datasets by clicking on blue key icon. It is useful for checking that your data load was successful or checking the geometry columns if you don’t see your data in the map.
...