2022-07-11
...
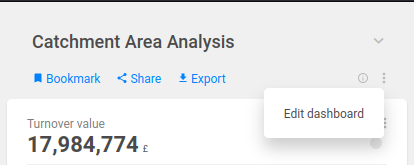
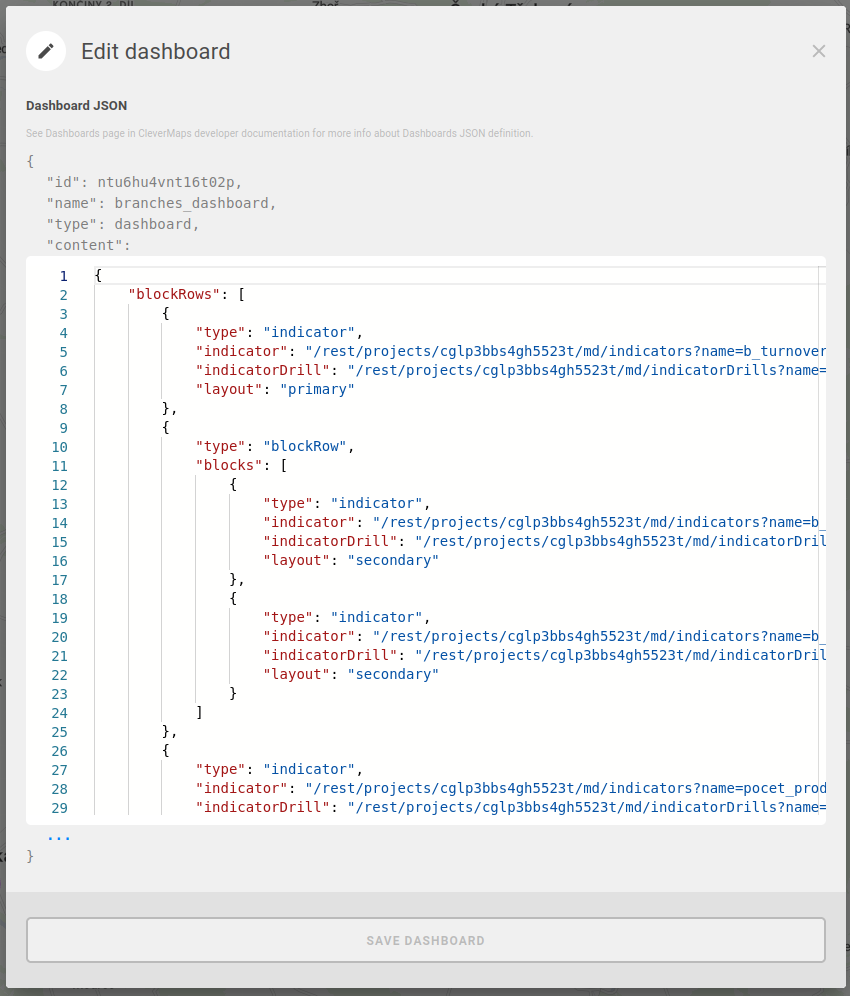
Edit a dashboard from UI
We added a feature to edit the JSON dashboard definition directly from the UI.

Redesigned visualization/granularity component
We have simplified the design of component for selecting visualization and granularity. User can now see all available visualizations and granularities.
...
Fix of missing geo search for markers and search by GPS coordinates
Increased maximum number of attribute values in MultiSelect filter to 20000
Fix duplicate marker icon when selecting a marker from the map.
...
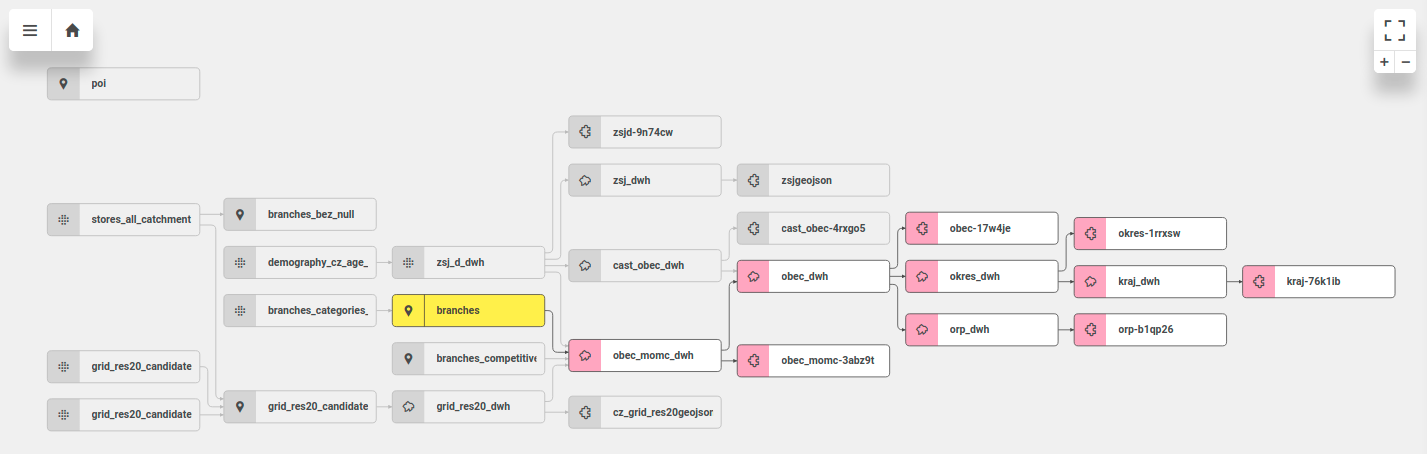
We have improved user interaction with Data model schema. You can use it in similar way as you use our map – mouse scroll works for zooming in or out and dragging can be used to pan the schema.
Relations between datasets in the schema are interactive. In case you select or hover some dataset, all related links and datasets remain active, others are muted. It helps you find the relations in large data models.
There is a new block Data Load History on the detail of dataset. It is available for administrators of the project. This gives you quick summary of all data modifications in the project. You can see when it happened and who made the change.
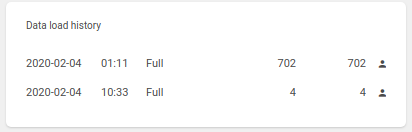
Date of load, time, type (Incremental or Full), count of records added, total count of records, user (details on hover)
You can preview the content of your datasets in with Data preview feature. You can enter this preview in dataset detail in the bottom of the Overview block.
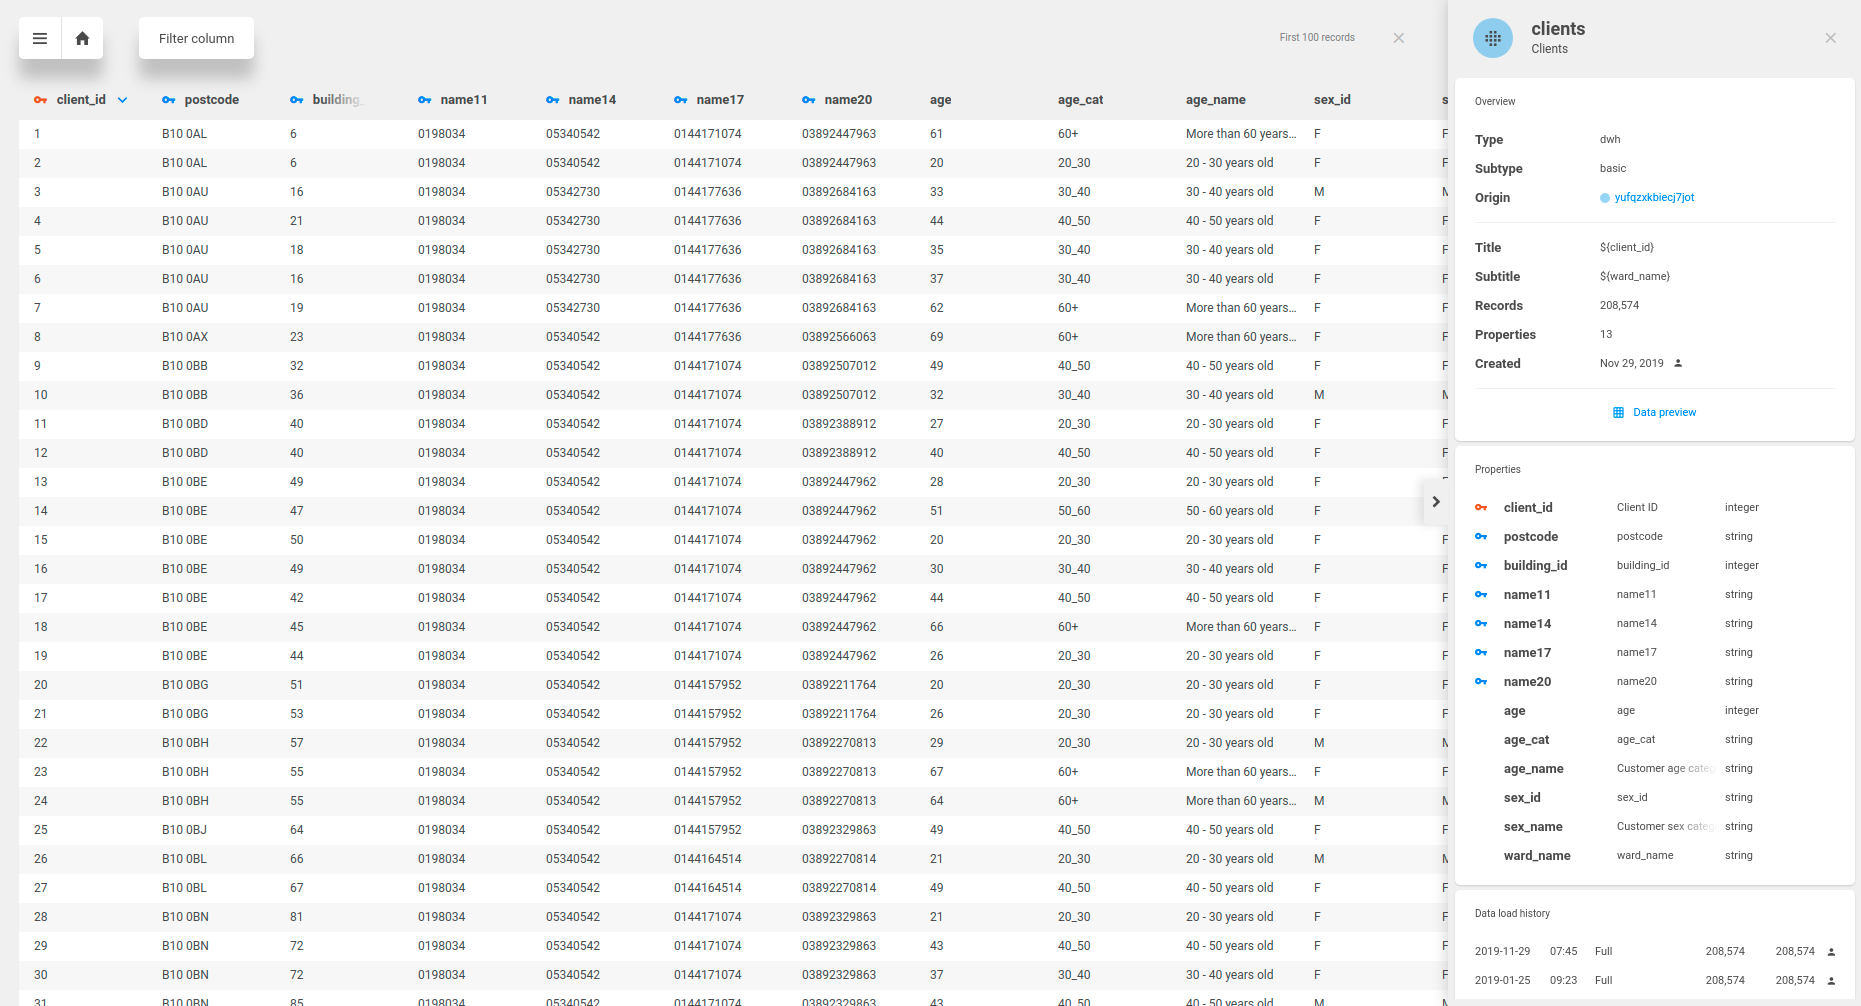
It is possible to sort the records by any column, filter records by property value with equality operator or easily go to linked datasets by clicking on blue key icon. It is useful for checking that your data load was successful or checking the geometry columns if you don’t see your data in the map.
...