2022-11-27
...
All drill blocks can be put under indicator directly on dashboard

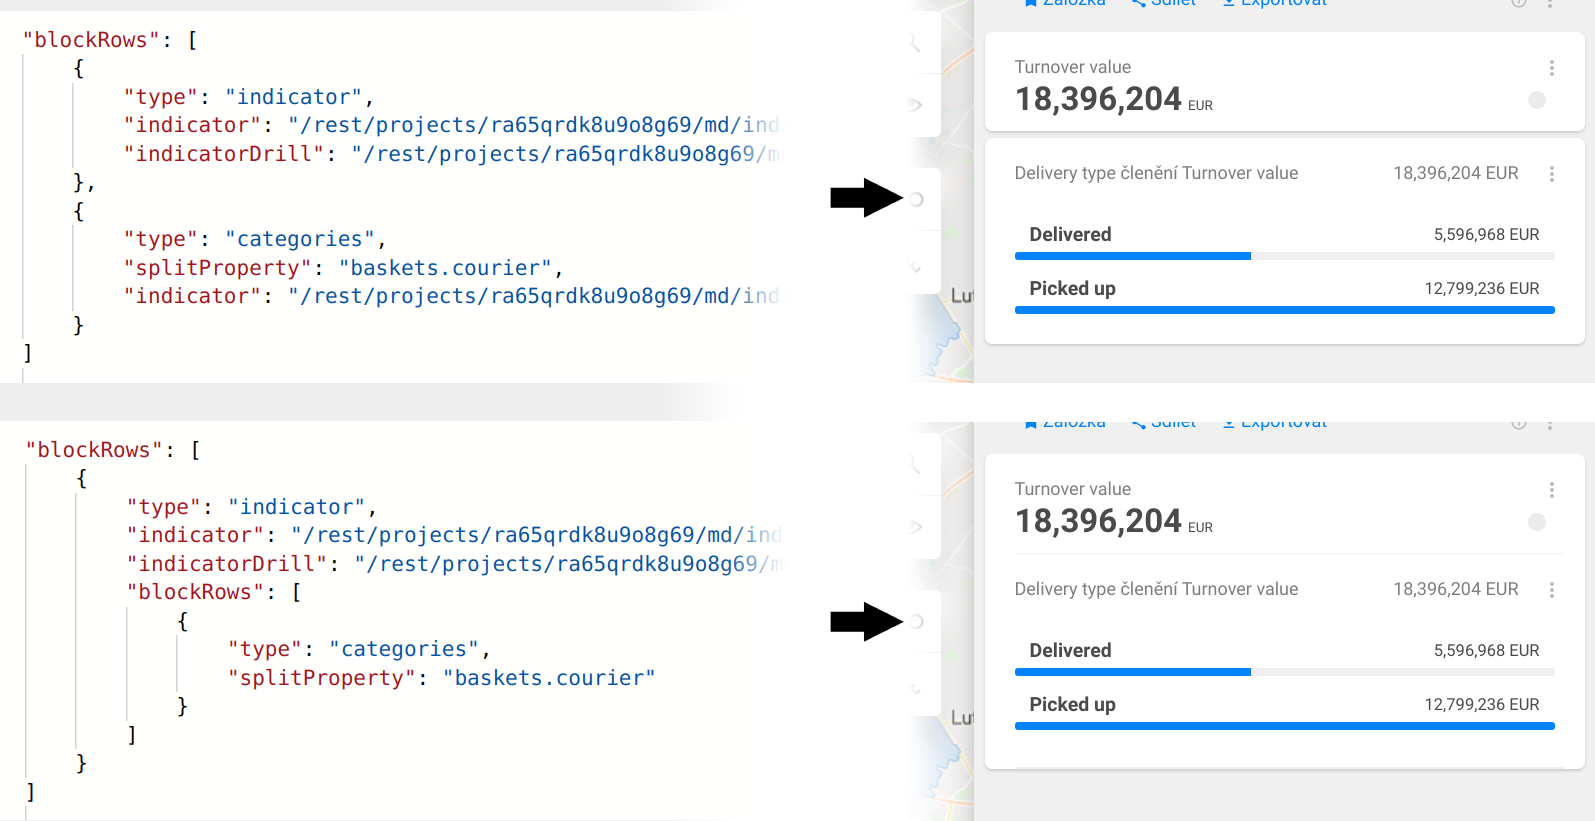
Drill blocks under indicator can be collapsed like rest of blocks
Metadata migration of drill block with onDashboard to drill blocks directly on dashboard under indicator

block.onDashboardfunctionality is considered deprecated and will be deleted soon. Do not use it anymore. Use blocks directly on dashboard.
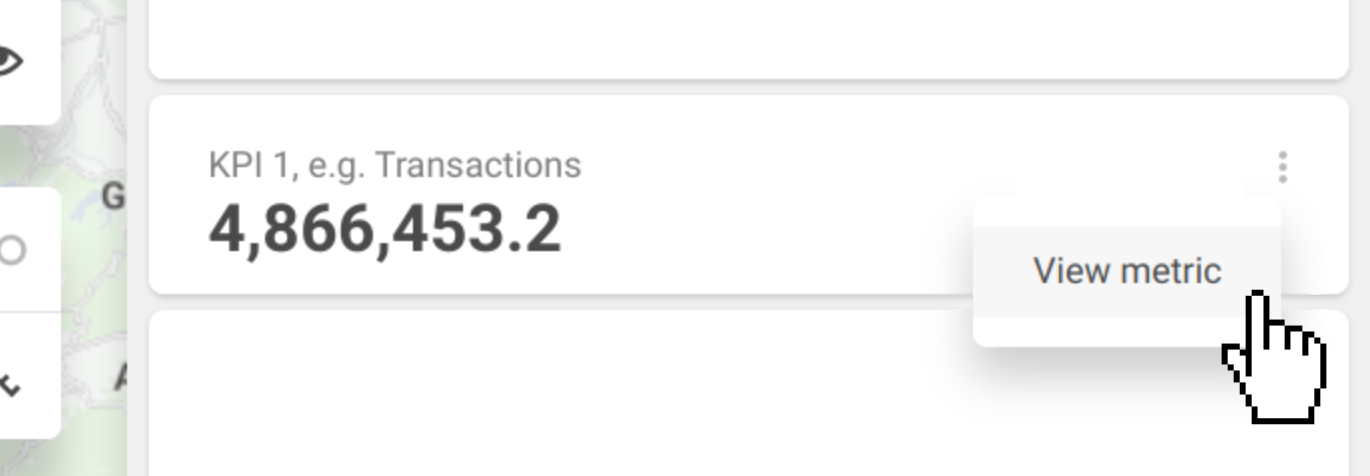
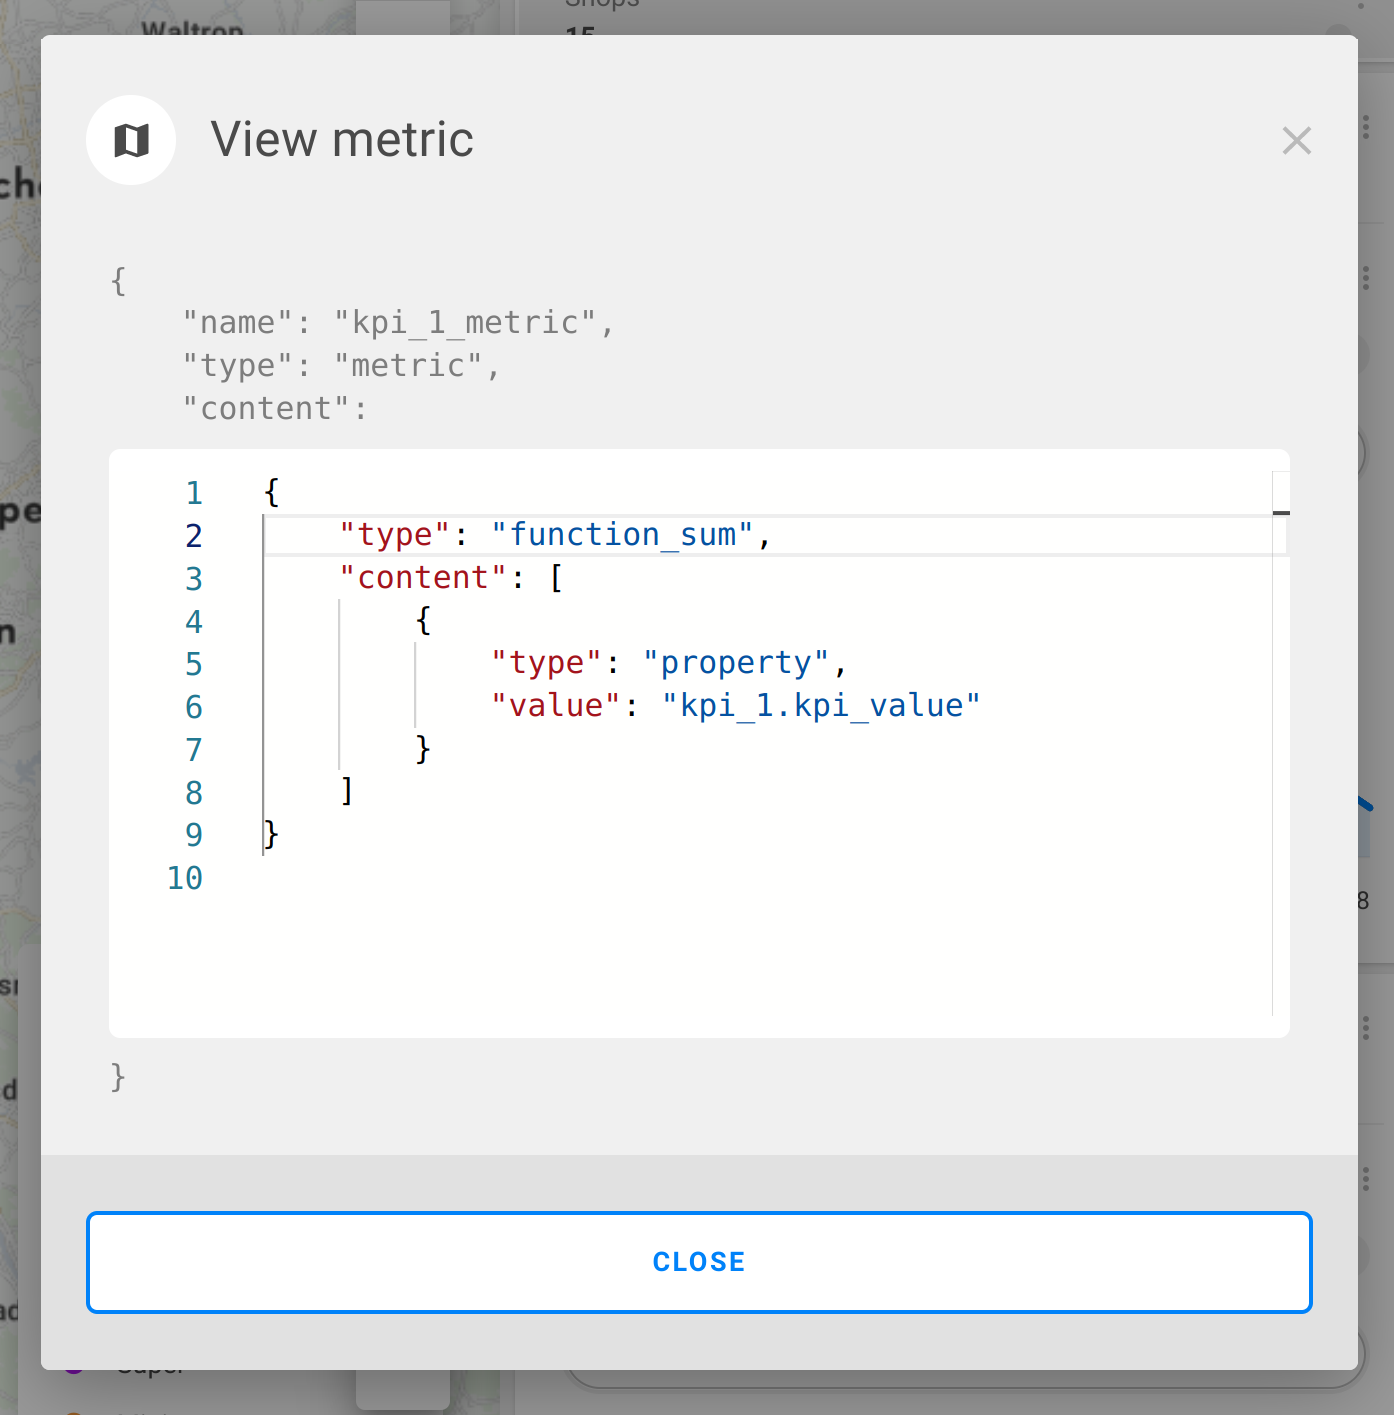
Viewer can show metric and dashboard metadata JSON definition


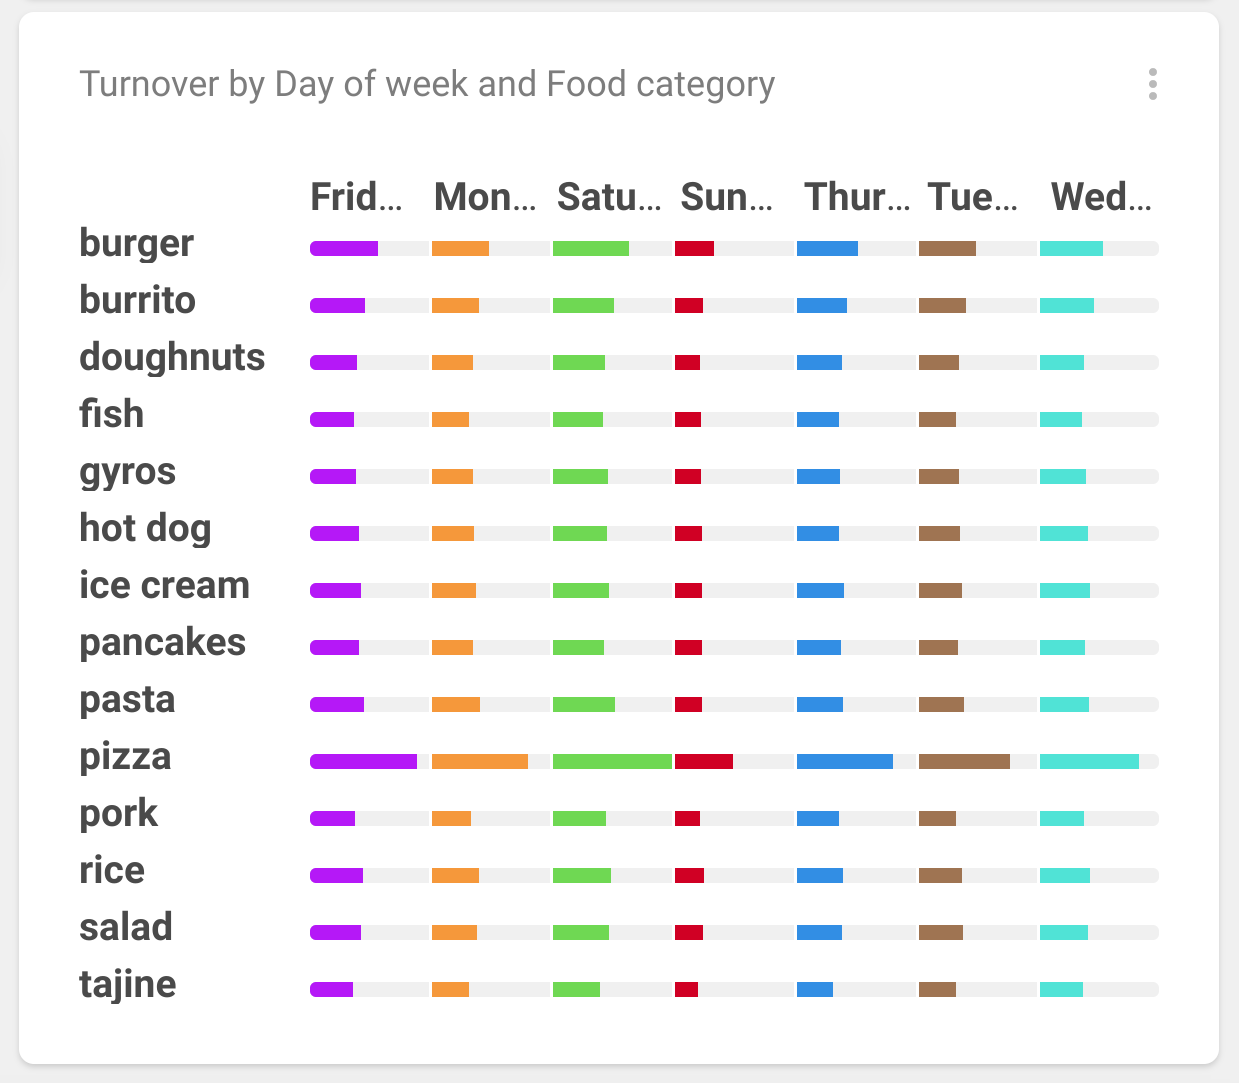
Improved condensed categories block
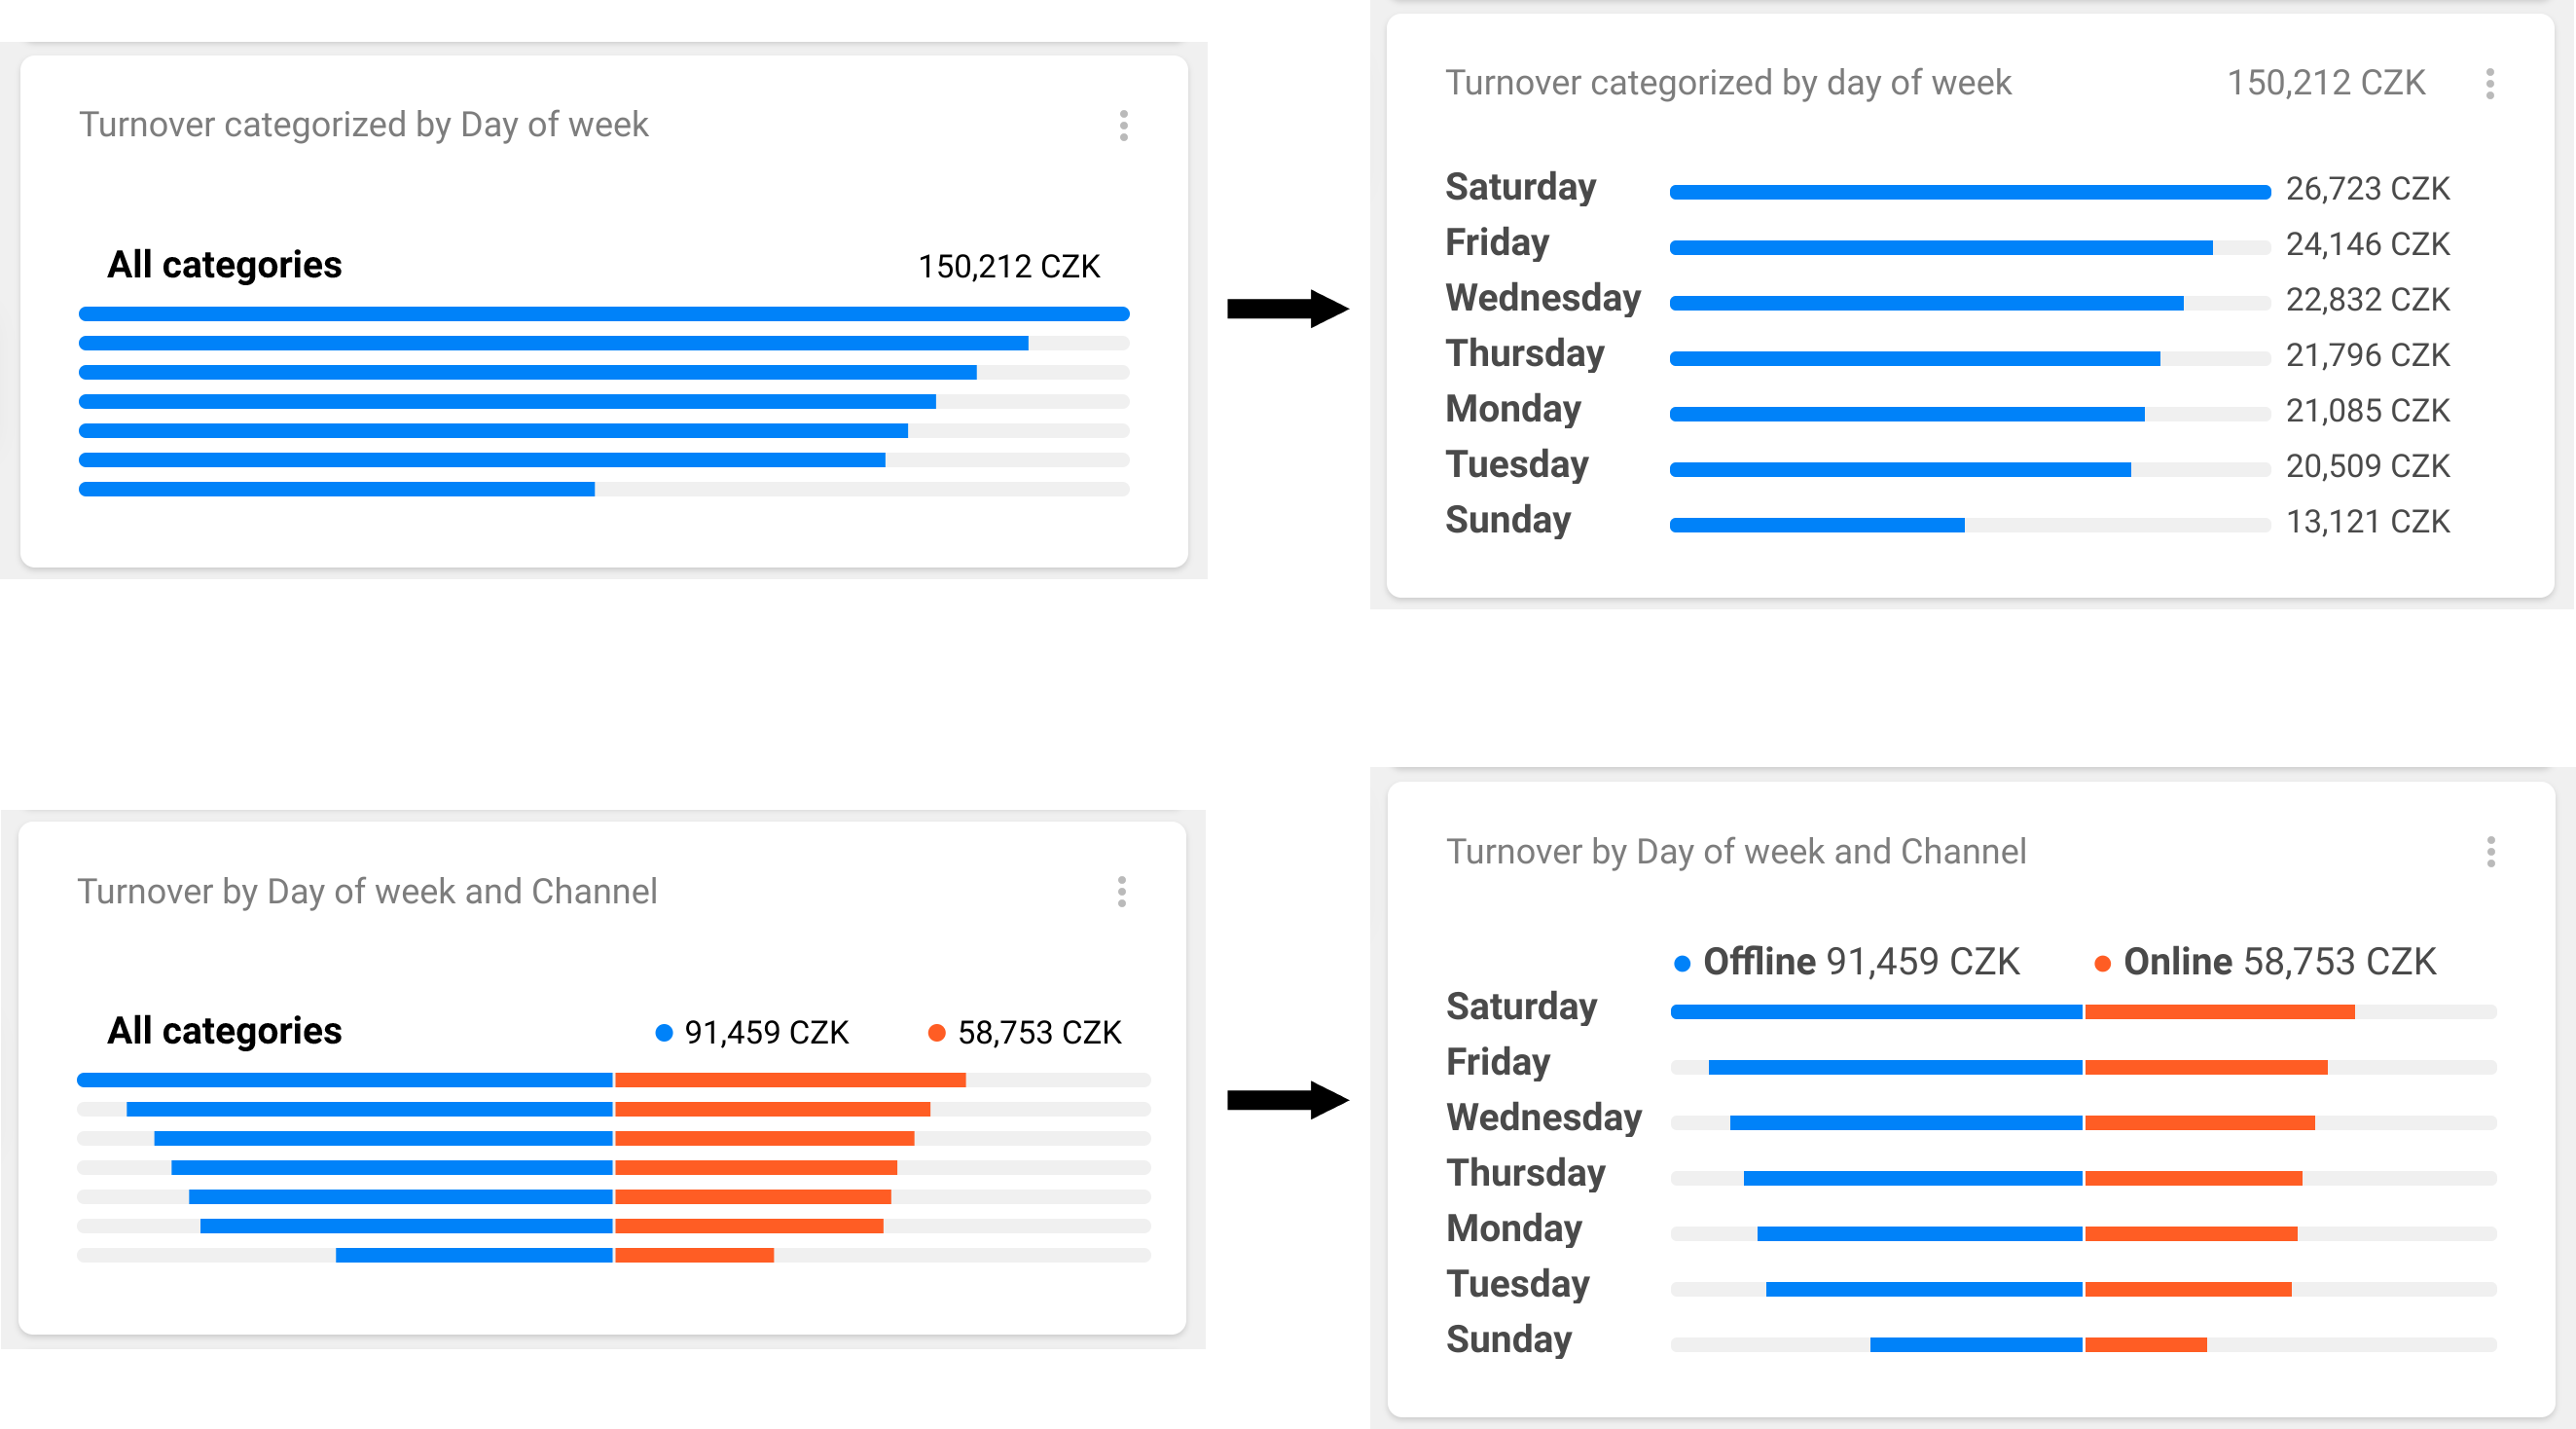

New dual categories block with more than one distinct attributes

clevermaps-js-sdk
Pass filter definition to filter listener callback as new parameter
Highly improved documentation https://www.npmjs.com/package/clevermaps-js-sdk
.png?version=1&modificationDate=1669549498354&cacheVersion=1&api=v2&width=104)
Bugfixes
Fix duplicated property ids in dwh queries which app constructed
Fix app freeze in infinite loop when adding a pinpoint to compare
Use reversed metric in categories values on drill in Arrival/Departure view
Fix collapse of distribution block
Show ranking even if loading of ranking item fitness fails
...
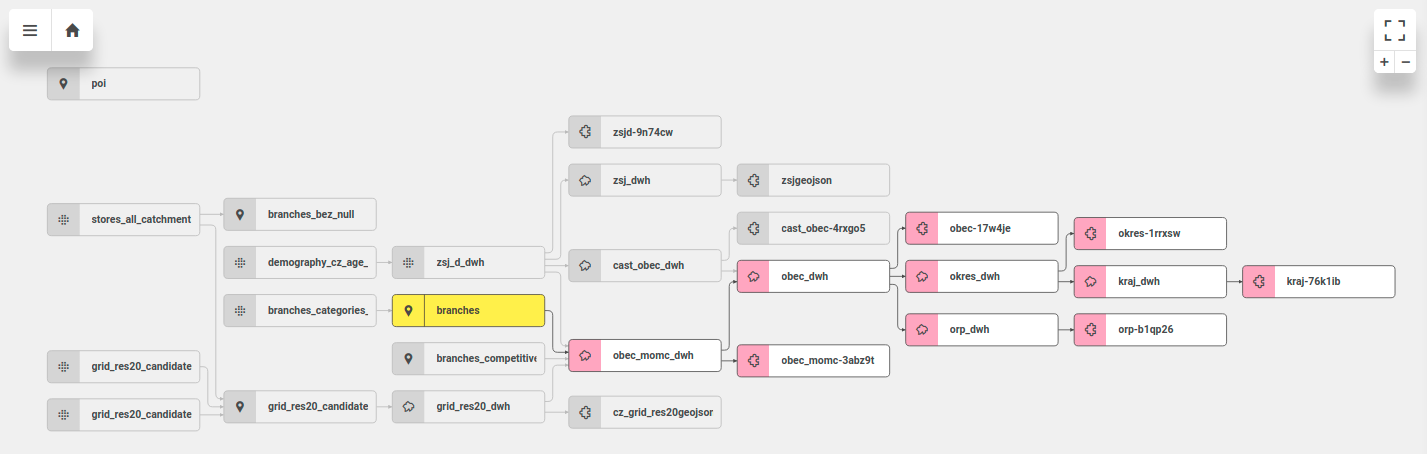
We have improved user interaction with Data model schema. You can use it in similar way as you use our map – mouse scroll works for zooming in or out and dragging can be used to pan the schema.
Relations between datasets in the schema are interactive. In case you select or hover some dataset, all related links and datasets remain active, others are muted. It helps you find the relations in large data models.
There is a new block Data Load History on the detail of dataset. It is available for administrators of the project. This gives you quick summary of all data modifications in the project. You can see when it happened and who made the change.
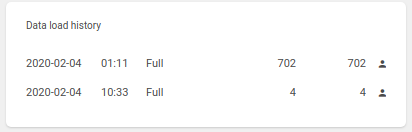
Date of load, time, type (Incremental or Full), count of records added, total count of records, user (details on hover)
You can preview the content of your datasets in with Data preview feature. You can enter this preview in dataset detail in the bottom of the Overview block.
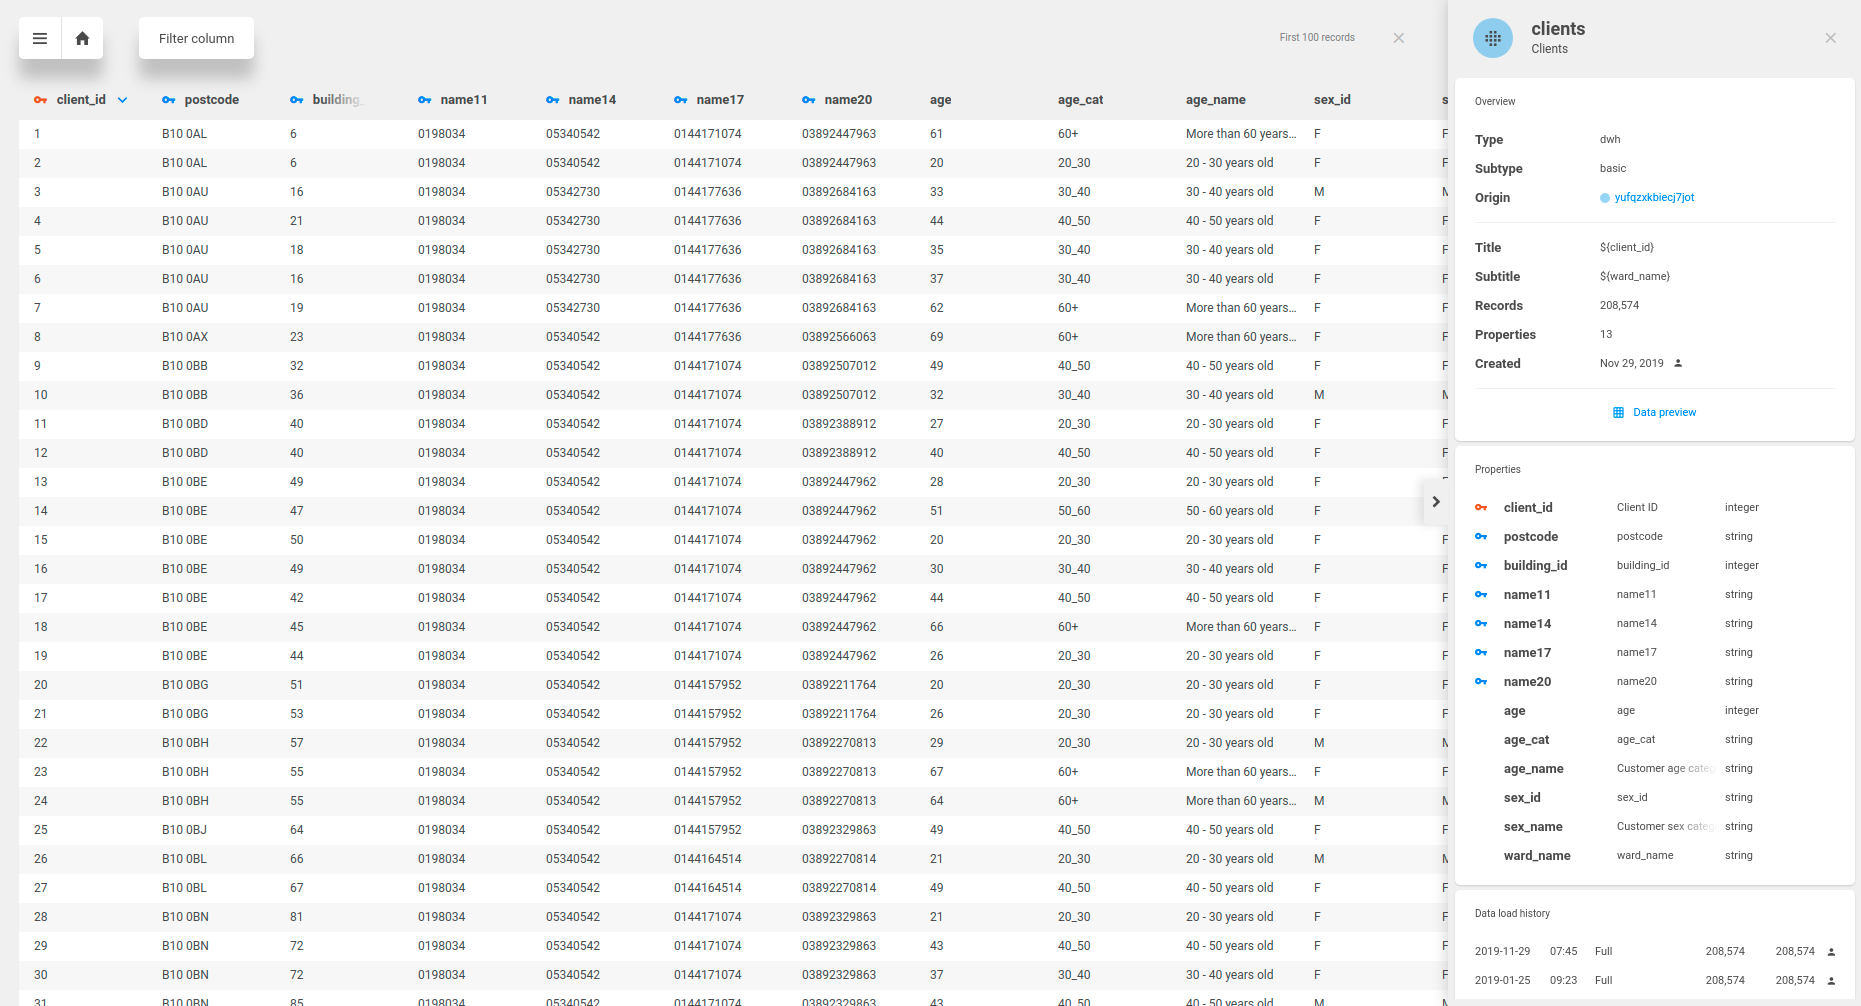
It is possible to sort the records by any column, filter records by property value with equality operator or easily go to linked datasets by clicking on blue key icon. It is useful for checking that your data load was successful or checking the geometry columns if you don’t see your data in the map.
...