Dashboard is an ordered list of indicators and indicator drill pairs.
...
It's the simplest way to display an array of indicators. Each of them has one row and is primary. For more customized dashboards, see the syntax examples and visual representation below.
Dashboard object syntax
...
Key | Type | Optionality | Description | Constraints | ||||||
|---|---|---|---|---|---|---|---|---|---|---|
| array |
| array of either:
see the syntax examples above | |||||||
| array |
| definition of dataset's featureAttributes and |
...
Key | Type | Optionality | Description | Constraints | ||||||
|---|---|---|---|---|---|---|---|---|---|---|
| string |
| type identifier, always |
| ||||||
| string |
| URL link to the indicator object |
| ||||||
| string |
| URL link to the indicator drill object |
| ||||||
| string |
| layout of the indicator when not specified, the indicator's layout is |
| ||||||
| boolean |
| determines if the indicator should be collapsed when entering the view | |||||||
| array |
| array of either:
|
...
Key | Type | Optionality | Description | Constraints | ||||||
|---|---|---|---|---|---|---|---|---|---|---|
| string |
| type identifier, always |
| ||||||
| string |
| title of the indicator group |
| ||||||
| string |
| description of the indicator group |
| ||||||
| boolean |
| determines if the group should be collapsed when entering the view |
| ||||||
| array |
| array of either:
see the syntax example above |
content.blockRows.categories
...
Allows you to define dataset's featureAttributes on dashboard. See above.
Key | Type | Optionality | Description | Constraints | ||||||
|---|---|---|---|---|---|---|---|---|---|---|
| string |
| URL link to the dataset, whose properties will be set |
| ||||||
| string |
| specifies if the dataset will be enabled in Refine search enable = dataset will be enabled disable = dataset will be disabled auto = dataset will be enabled if its features are visible in the map |
| ||||||
| array |
| array of dataset.properties.featureAttributes |
...
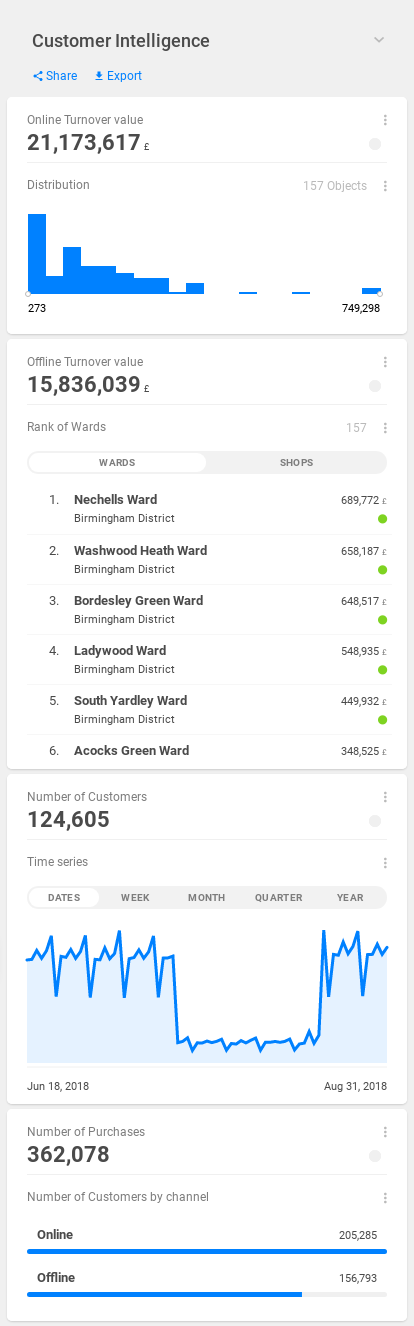
Dashboard with indicator drill blocks
To display an indicator an indicator drill block directly on a dashboard, you can set its onDashboard property to trueadd block to indicator in blockRows. It is possible to display all four blocks: distribution, ranking, timeSeries and categories.
Each block on a dashboard can be collapsed / expanded, by using the right click and selecting "Collapse this indicator" / "Expand this indicator".
indicator drill blocksonDashboard | block collapse / expand option |
 | 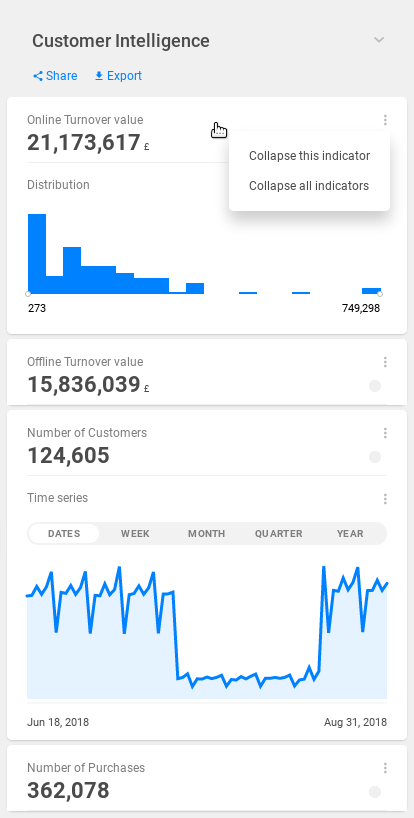 |
...