An indicator represents a phenomenon that can be displayed on a map. It allows the user to configure how the phenomenon will be displayed. Indicator has a reference to a metric, which is a mathematical expression of the phenomenon. Indicators are further analysed in indicator drills, with whom they are paired with and displayed in a dashboard.
...
| Key | Type | Optionality | Description | Constraints | ||||||||
|---|---|---|---|---|---|---|---|---|---|---|---|---|
metric | string |
| URL link to the metric object | /rest/projects/$projectId/md/metrics?name={metricName} | ||||||||
scale | string |
| sets the scale coloring, see the examples below default = |
| ||||||||
distribution | string |
| defines the distribution of the indicator values default = | [ | ||||||||
visualizations | object |
| object specifying available visualizations of the indicator | |||||||||
format | object |
| object specifying formatting of the indicator value | |||||||||
relations | object |
| object specifying the relations of the indicator's metric | |||||||||
scaleOptions | object |
| object specifying the scale options |
...
See the scales coloring visual representation below.
The distribution affects the intensity of the coloring from the beginning to the end of the scale. The rule of thumb when picking the correct distribution is to try them both, and see what works best for each indicator.
...
areas(based ongeometryPolygonsubtype dataset)gridgeometryPolygonsubtype dataset)zonesgeometryPolygonsubtype dataset)heatmap(based ongeometryPointsubtype dataset)dotmap(based ongeometryPointsubtype dataset)line(based ongeometryLinesubtype dataset)
| grid | zones | heatmap | dotmap | line |
|---|---|---|---|---|---|
|  |  |  |  |  |

This object also allows to enable the Dominance visualization in the Compare tool ( ).
).
See the visualization examples below.
| Key | Type | Optionality | Description | Constraints | ||||||||
|---|---|---|---|---|---|---|---|---|---|---|---|---|
areas | boolean |
| enables areas visualization | [true, false] | ||||||||
grid | boolean |
| enables grid visualization | [true, false] | ||||||||
zones | boolean |
| enables zones visualization | [true, false] | ||||||||
heatmap | boolean |
| enables heatmap visualization | [true, false] | ||||||||
dotmap | boolean |
| enables dotmap visualization | [true, false] | ||||||||
line | boolean |
| enables line visualization | [true, false] | ||||||||
dominance | boolean |
| enables the dominance visualization in the Compare tool | [true, false] | ||||||||
heatmapScaleFactor | decimal |
| sets the scale factor of a heatmap visualization | x => 0.0 |
...
See complete indicator example above.
| Key | Type | Optionality | Description | Constraints | ||||||||
|---|---|---|---|---|---|---|---|---|---|---|---|---|
static | array |
| array of static specifies the default settings of a | x => 0 | ||||||||
defaultDistribution | object |
| specifies the default settings of a distribution block |
...
| Key | Type | Optionality | Description | Constraints | ||||||||
|---|---|---|---|---|---|---|---|---|---|---|---|---|
zoom | integer |
| zoom level, for which the
|
| ||||||||
global | decimal |
| global scale value (= no marker selected) |
| ||||||||
selection | decimal |
| selected scale value (= when a marker is selected) | x => 0.0 |
...
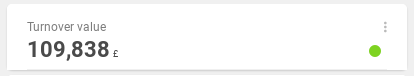
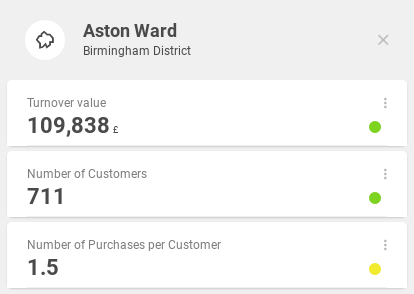
Indicators are represented as a list of cards in a dashboard.
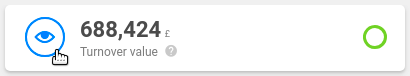
Turnover value indicator
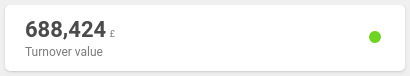
In this area, the turnover value in selected time frame is 688,424 £.
Turnover value indicator after a mouse hover
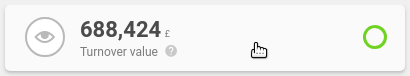
Turnover value indicator with a mouse hover on the fitness
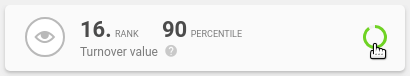
This ranks the area as 16th, which gives it a 90 percentile.
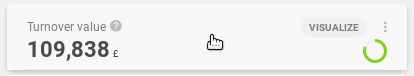
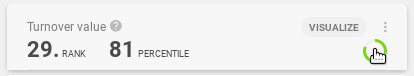
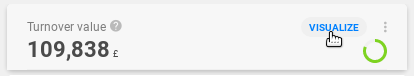
Turnover value indicator with a mouse hover on the Visualize button
Three indicators in a specific area
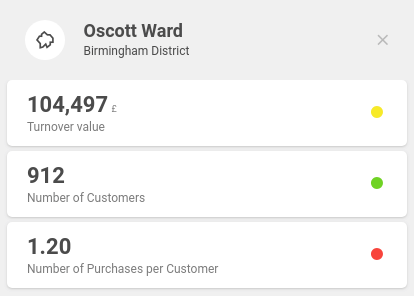
Here, we see an area - Oscott ward in the Birmingham district, described by three indicators. They tell us that a total of 912 customers live in this area, and the average number of purchases per customer is 1.20. In the selected time frame, these customers generated 104,497 £ turnover.
...