An indicator represents a phenomenon that can be displayed on a map. It allows the user to configure how the phenomenon will be displayed. Indicator has a reference to a metric, which is a mathematical expression of the phenomenon. Indicators are further analysed in indicator drills, with whom they are paired with and displayed in a dashboard.
...
| Key | Type | Optionality | Description | Constraints | ||||||||
|---|---|---|---|---|---|---|---|---|---|---|---|---|
metric | string |
| URL link to the metric object | /rest/projects/$projectId/md/metrics?name={metricName} | ||||||||
scale | string |
| sets the scale coloring, see the examples below default = |
| ||||||||
distribution | string |
| defines the distribution of the indicator values default = | [ | ||||||||
visualizations | object |
| object specifying available visualizations of the indicator | |||||||||
format | object |
| object specifying formatting of the indicator value | |||||||||
relations | object |
| object specifying the relations of the indicator's metric | |||||||||
scaleOptions | object |
| object specifying the scale options |
...
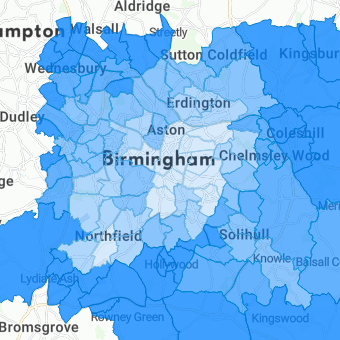
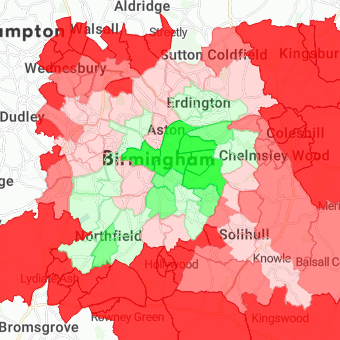
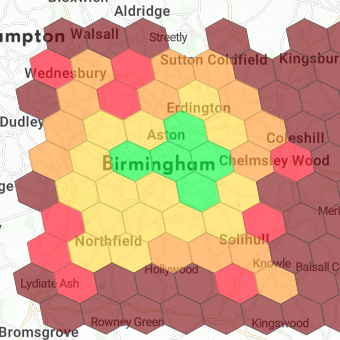
standardscale has 5 segments and is generally used for any indicator, e.g. average purchase valuepositivescale has 5 segments and is generally used for positive indicators, e.g. increase of customersnegativescale has 5 segments and is generally used for negative indicators, e.g. decrease of customersinversescale has 5 segments and is the same asstandard, but the colors are flipped, it can be used to identify e.g. white spots on a mapbinaryStandardscale has 2 segments and is used the same way asstandard, but just for binary values, e.g. to indicate if there is a shop in the area, or notbinaryNegativescale has 2 segments and is used the same way asnegative, but just for binary values, e.g. to indicate if the area had a decrease of customers, or notdivergingStandardscale has 6 segments and is used for indicators that can positive and negative values, e.g. turnover value differencedivergingNegativeis used the same way asdivergingStandardscale, but the colors are flipped, it can be used to indicate e.g. competition turnover value differencedivergingWithZeroStandarddivergingWithZeroNegativescales have 5 segments, with a neutral middle segmentheat,heatmap,traffic,trafficInverse,magma,viridisscales have 5 segments
...
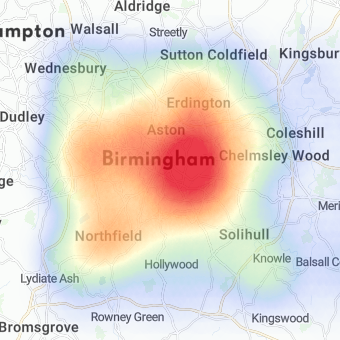
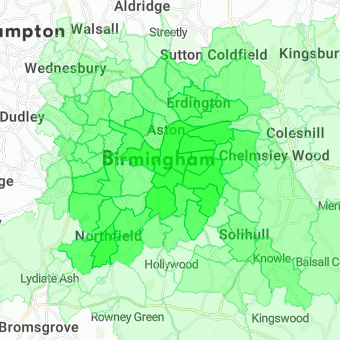
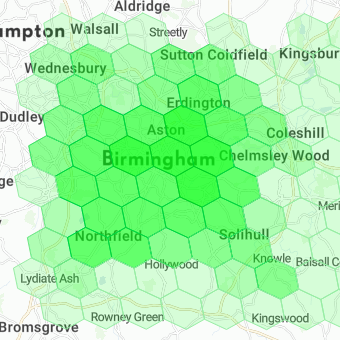
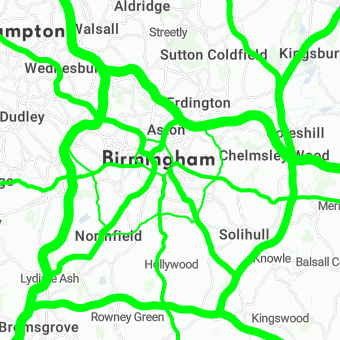
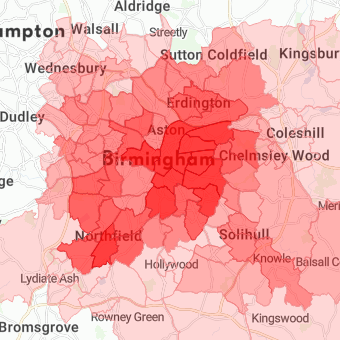
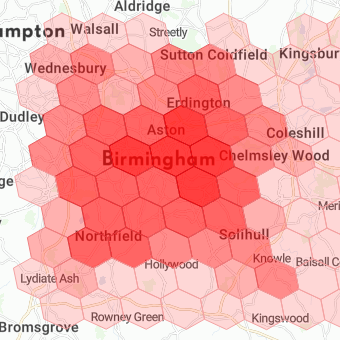
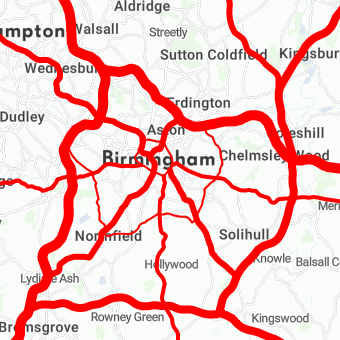
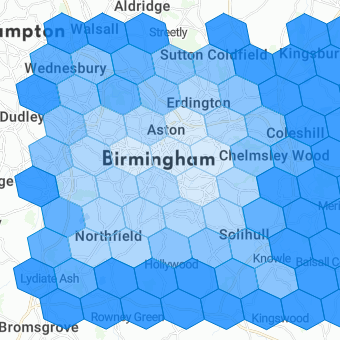
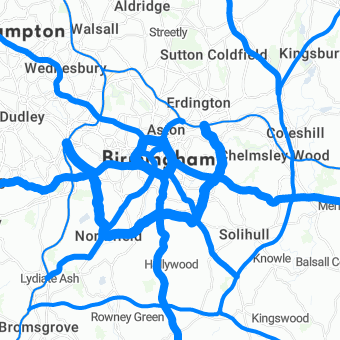
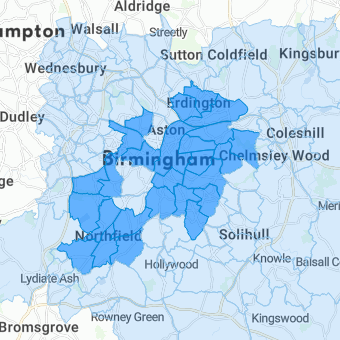
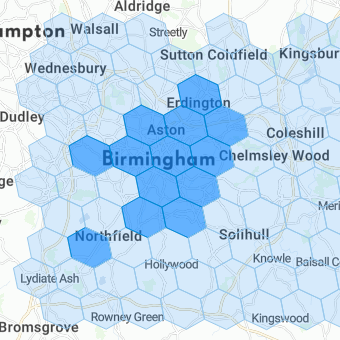
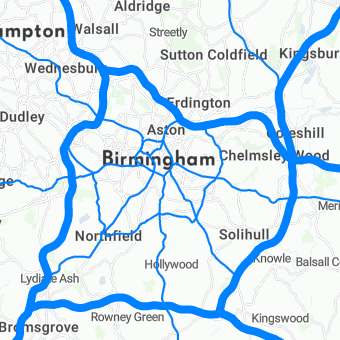
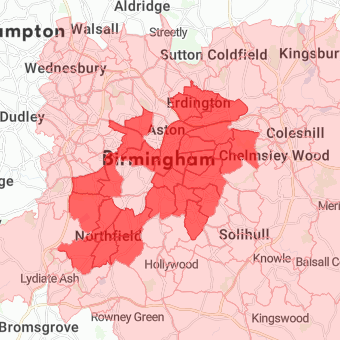
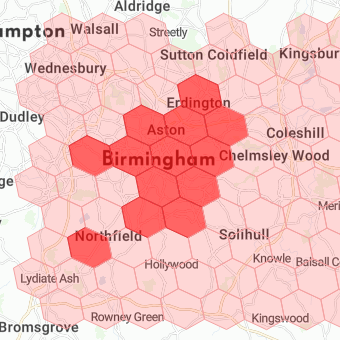
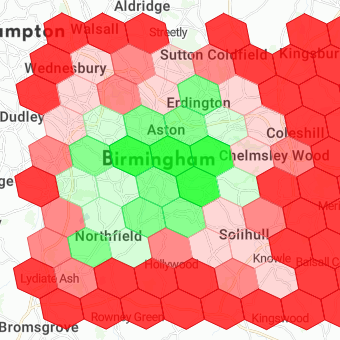
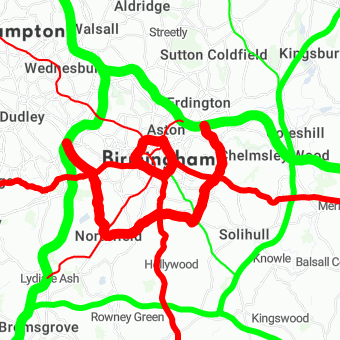
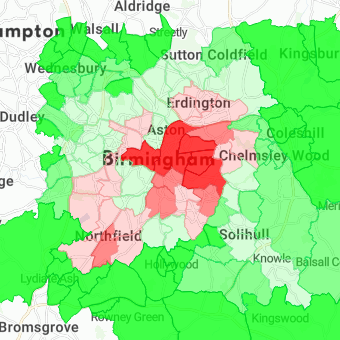
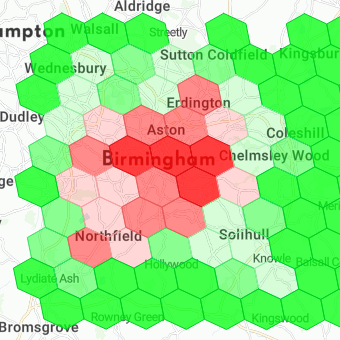
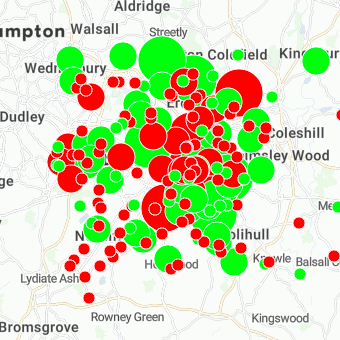
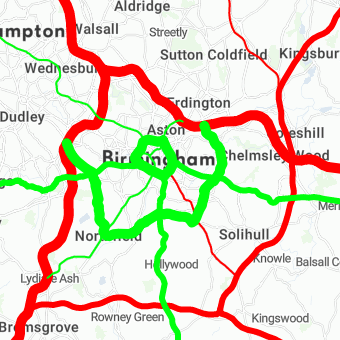
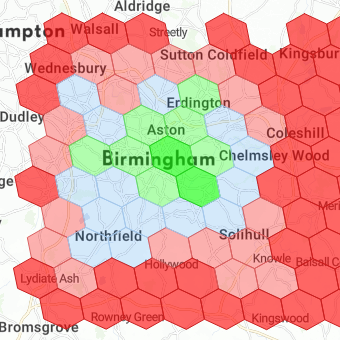
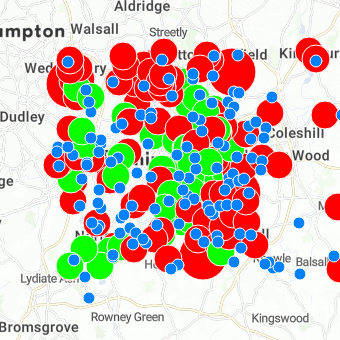
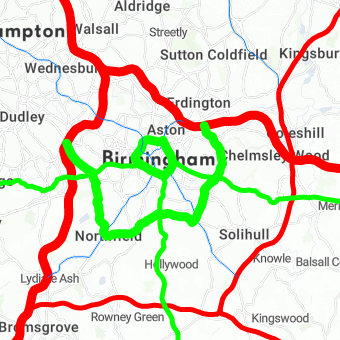
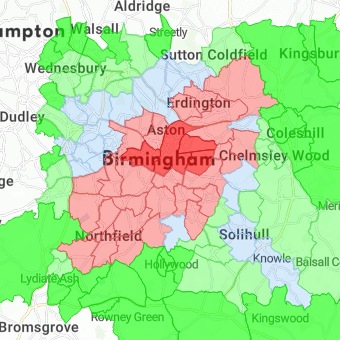
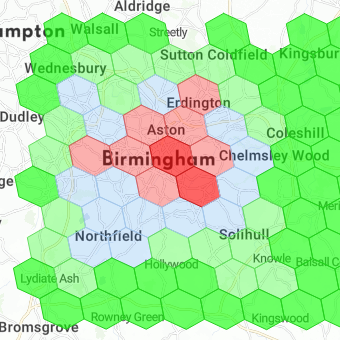
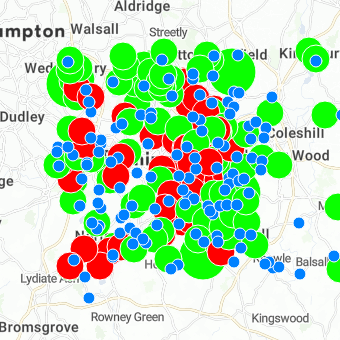
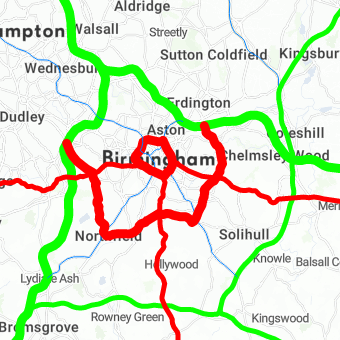
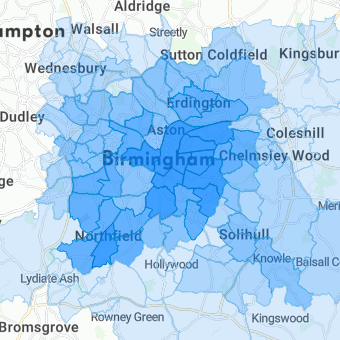
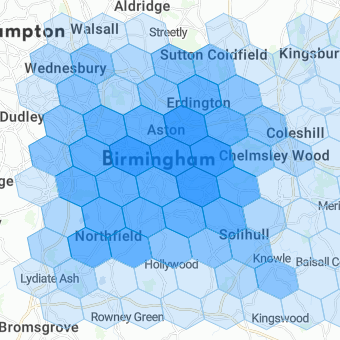
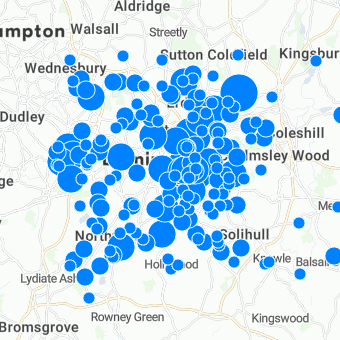
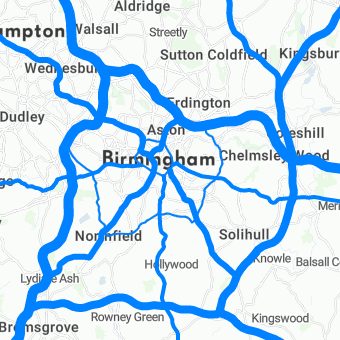
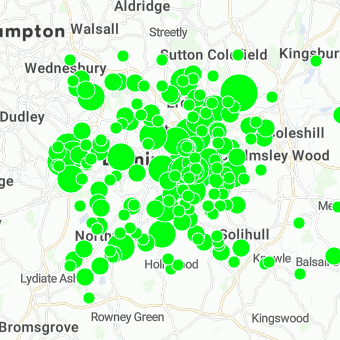
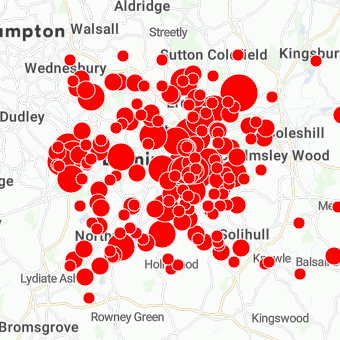
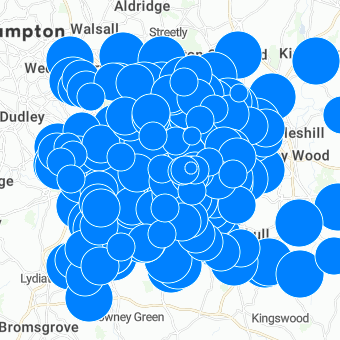
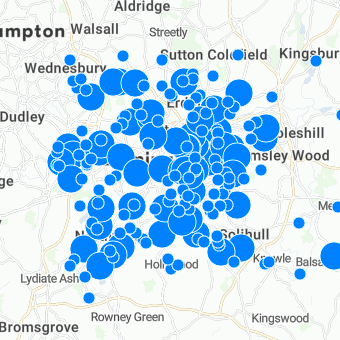
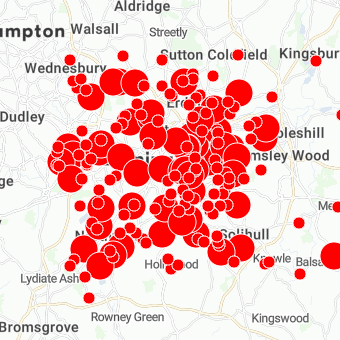
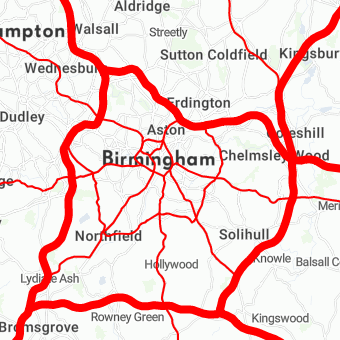
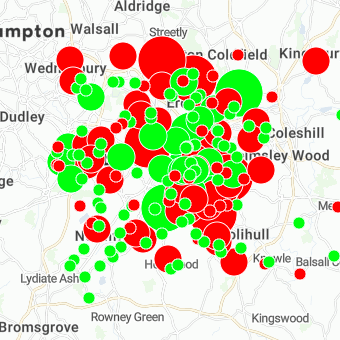
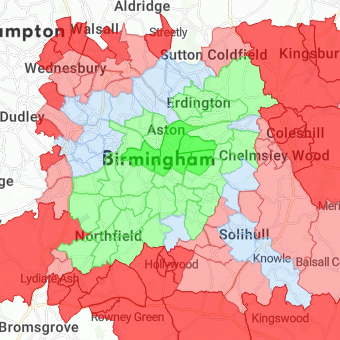
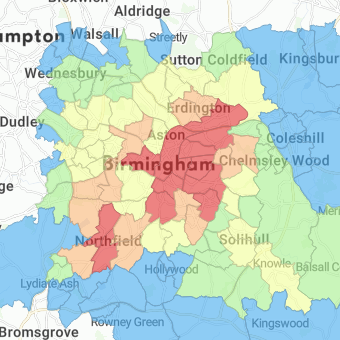
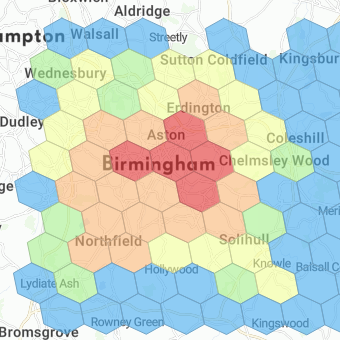
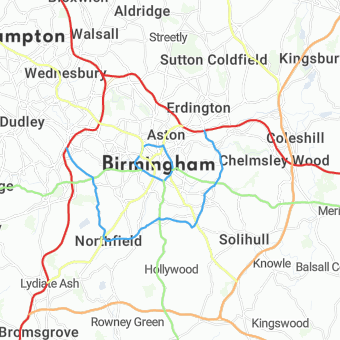
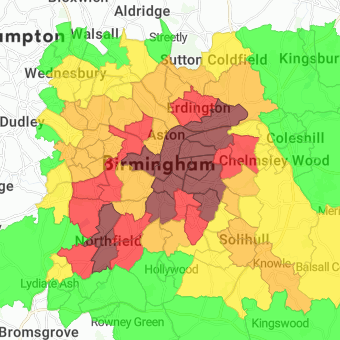
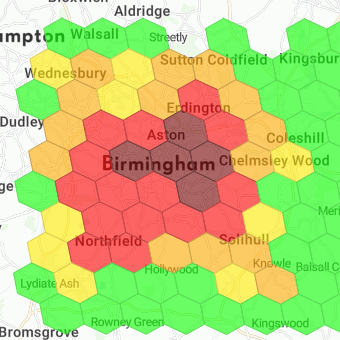
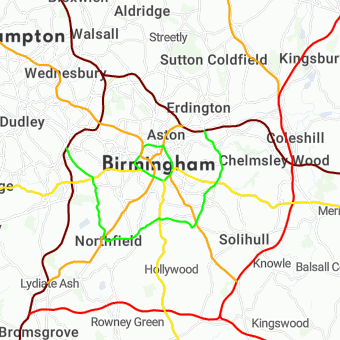
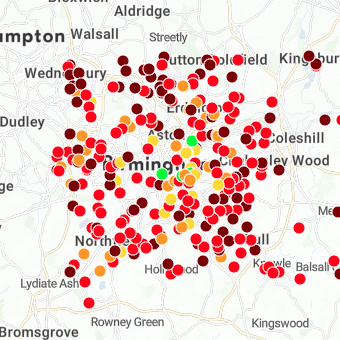
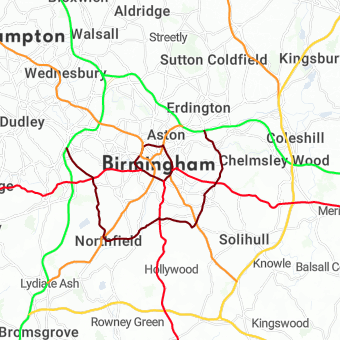
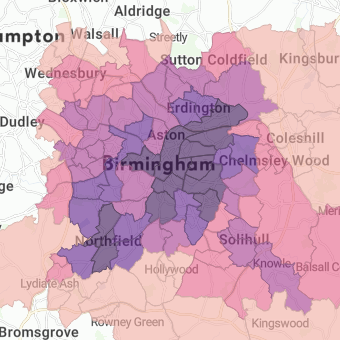
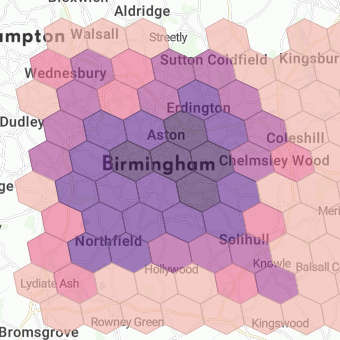
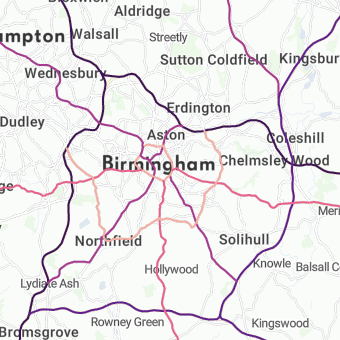
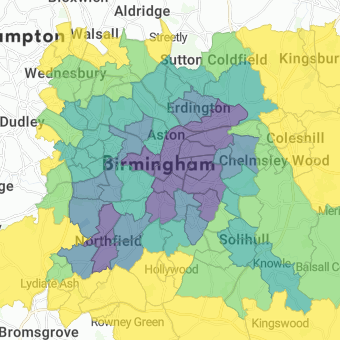
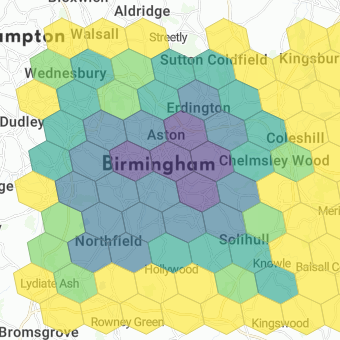
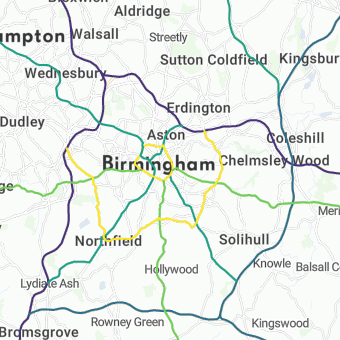
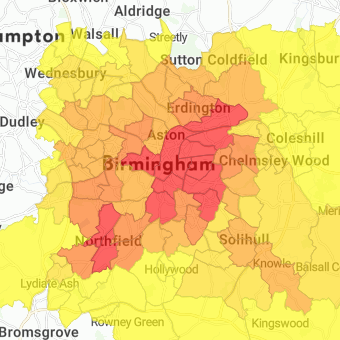
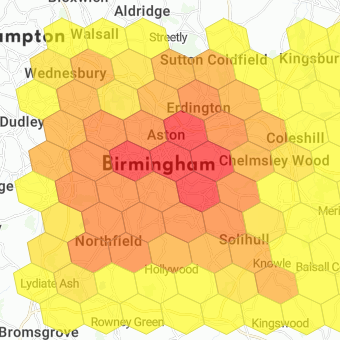
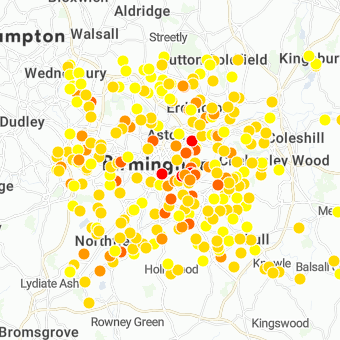
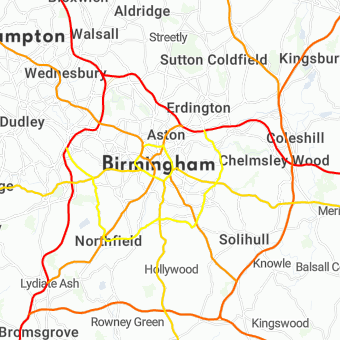
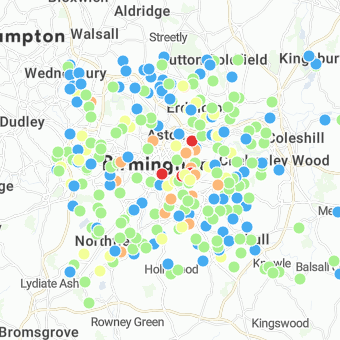
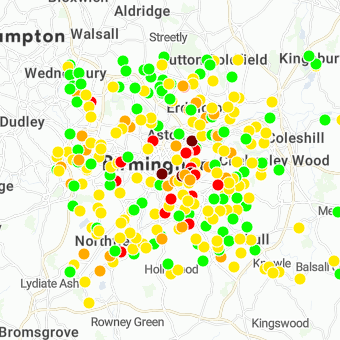
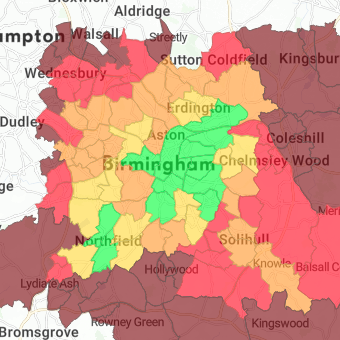
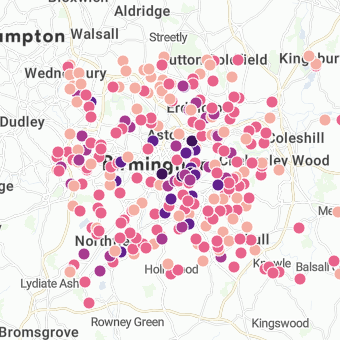
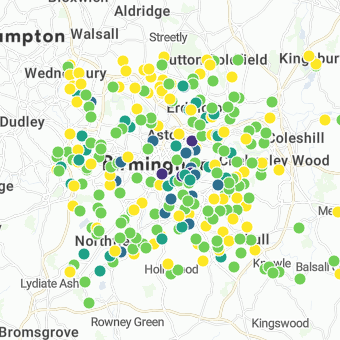
areas(based ongeometryPolygonsubtype dataset)gridgeometryPolygonsubtype dataset)zonesgeometryPolygonsubtype dataset)heatmap(based ongeometryPointsubtype dataset)dotmap(based ongeometryPointsubtype dataset)line(based ongeometryLinesubtype dataset)
| grid | zones | heatmap | dotmap | line |
|---|---|---|---|---|---|
|  |  |  |  |  |

This object also allows to enable the Dominance visualization in the Compare tool ( ).
).
...
| Key | Type | Optionality | Description | Constraints | ||||||||
|---|---|---|---|---|---|---|---|---|---|---|---|---|
global | array |
| array of distribution break values (integer or decimal) these breaks will be applied when no object is selected |
| ||||||||
selection | array |
| array of distribution break values (integer or decimal) these breaks will be applied when an object is selected (area or a marker) |
|
content.scaleOptions.static.maxValues
...
| Key | Type | Optionality | Description | Constraints | ||||||||
|---|---|---|---|---|---|---|---|---|---|---|---|---|
zoom | integer |
| zoom level, for which the
|
| ||||||||
global | decimal |
| global scale value (= no marker selected) |
| ||||||||
selection | decimal |
| selected scale value (= when a marker is selected) | x => 0.0 |
...
| scale / visualization | areas | grid | dotmap | line | heatmap |
|
|
|
|
|  |
|  |  |
|  |
|
|  |  |
|  |
|
|  |  |
|  |
|
|  |  |
|  |
|
|  |  |
|
|
|
|  |  |
|  |
|
|  |  |  |  |
|
|
|  |  |  |
|
|  |  |  |  |
|
| scale / visualization | areas | grid | dotmap | lines | heatmap |
|
|
|
|
|
|
|  |  |
|  |
|
|  |  |
|  |
|
|
|  |  |  |
|
|  |  |
|  |
|
|  |  |
|  |
|
...