In this tutorial, you will learn how to set up a data export. Each export si defined in the export object.
| Table of Contents |
|---|
What you'll create
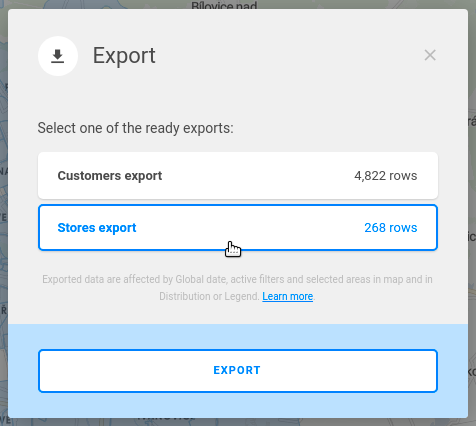
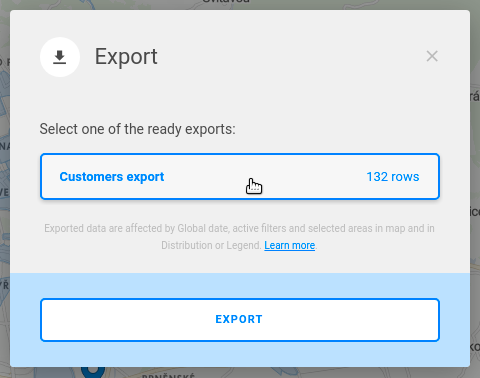
This is the export window, where you can download the export in a CSV file.
Customers export
Let's have a look at our customers dataset one more time. We will identify the properties that will be included in our export. Note that all active filters and the map selection are counted in the exports.
The requirement is to export customers, who have made a transaction bigger than 3000 CZK, to give them a special voucher.
The properties we want to include are: customer_id, address, sex and age_group.
...
The export object will look like this:
| Code Block | ||
|---|---|---|
| ||
{
    "name": "customers_export",
    "type": "export",
    "title": "Customers export",
    "content": {
        "properties": [
            "customers.customer_id",
            "customers.address",
            "customers.sex",
            "customers.age_group"
        ]
    }
} |
Add this export object to the project using addMetadata. Now we just need to add the export reference to the business_overview_view object.
| Code Block | ||
|---|---|---|
| ||
      ...
            "mapOptions": {
                "center": {
                    "lat": 49.203,
                    "lng": 16.606
                },
                "zoom": 12,
                "tileLayer": "mapbox"
            },
            "exports": [
                {
                    "export": "/rest/projects/$projectId/md/exports?name=customers_export"
                }
            ]
        },
        "accessInfo": {
... |
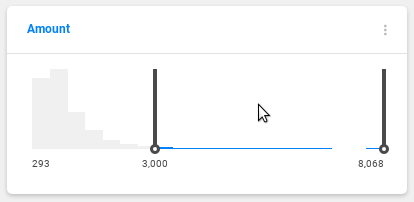
Before we perform the export, we have to apply the required filter first.
Applied histogram filter on the transaction_size property
Also, don't forget to that the map window should contain all available areas.
The export is available after clicking the Menu button in the top left corner ( ), and selecting Export.
Select Transactions export and hit Export.
The selected columns, as well as metric results will be present in the transactions_export.csv file. You can see that the metric results do not hold much informational value, because the metrics are not computable for each transaction (e.g. turnover value of one transaction equals to the transaction_value property).
Stores export
This is the stores dataset we've added in the previous tutorial.
...
opening_hours
...
Opening hours
...
We won't put any filters on this export and we'll export these properties: store_id, address, store_type, contact.
It is possible to include properties from other datasets in an export. We will include some properties from datasets of the Administrative units dimension we've added in one of the previous tutorials.
cast_obec_dwh.nazev- the city district where the store is locatedokres_dwh.- name of the countynazevkraj_dwh.- name of the regionnazev
| Code Block | ||
|---|---|---|
| ||
{
    "name": "stores_export",
    "type": "export",
    "title": "Stores export",
    "content": {
        "properties": [
            "stores.store_id",
            "stores.address",
            "stores.store_type",
            "stores.contact",
            "cast_obec_dwh.nazev",
            "okres_dwh.nazev",
            "kraj_dwh.nazev"
        ]
    }
} |
Add the object using addMetadata and add the export reference to the business_overview_view object.
| Code Block | ||
|---|---|---|
| ||
      ...
            "mapOptions": {
                "center": {
                    "lat": 49.203,
                    "lng": 16.606
                },
                "zoom": 12,
                "tileLayer": "mapbox"
            },
            "exports": [
                {
                    "export": "/rest/projects/$projectId/md/exports?name=customers_export"
                },
                {
                    "export": "/rest/projects/$projectId/md/exports?name=stores_export"
                }
            ]
        },
        "accessInfo": {
... |
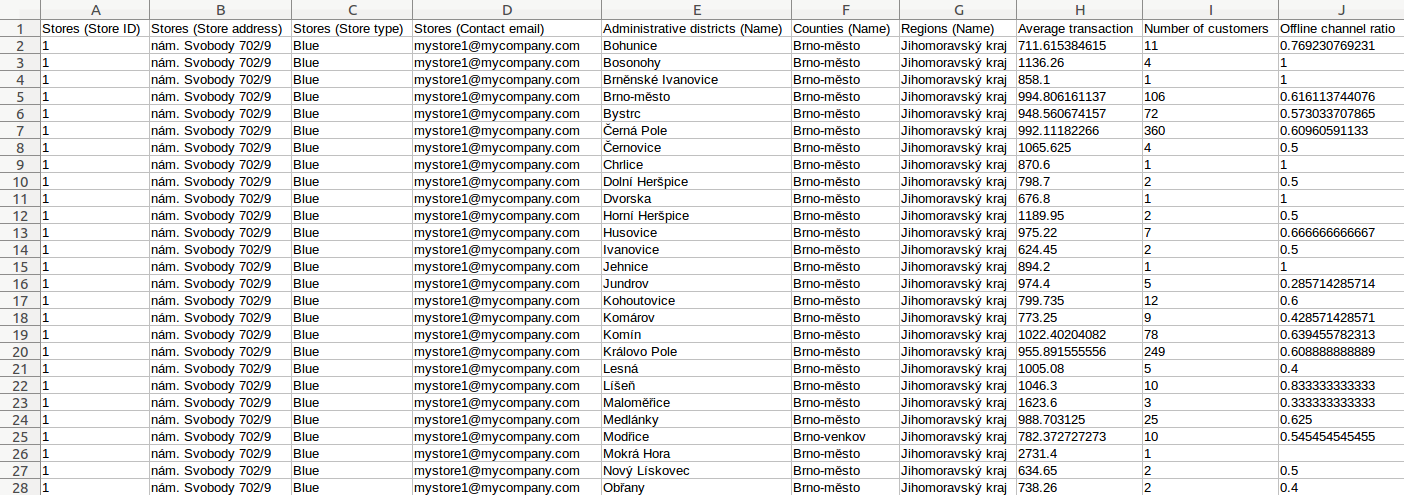
Push the object using pushProject. Then repeat the export process, but select Stores export and hit Export.
You can see that the stores_export.csv contains all six stores, with respective results of all metrics in all city districts.
| Info | ||||||||
|---|---|---|---|---|---|---|---|---|
| ||||||||
| Panel | ||||||||
| ||||||||
The content you are trying to reach has been moved here: https://docs.clevermaps.io/docs/tutorial-7-setting-up-data-exportWe are proud to announce that we have launched a new documentation. Please update your saved links and bookmarks to follow a new address docs.clevermaps.io. |