In this tutorial, we'll drill down on the data to further analyze it. This is possible using indicator drills.
| Table of Contents |
|---|
What you'll create
An indicator drill inspecting the turnover_value_indicator.
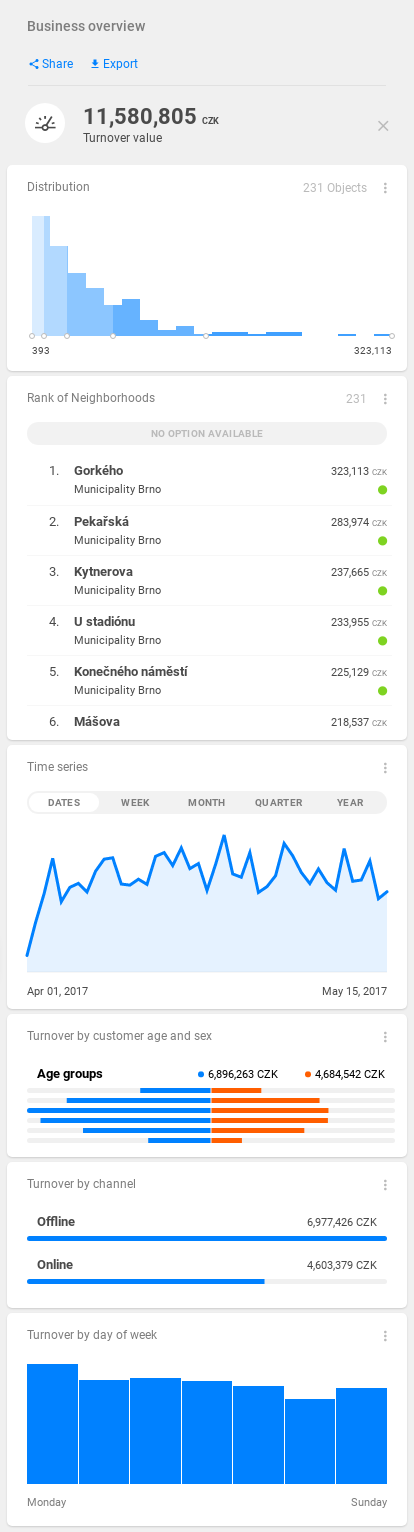
Creating a indicator drill
We already have empty_indicator_drill in our project from the first tutorial, which served as a placeholder so far. Let's create a copy of it and add in some blocks.
Use copyMetadata command to create a copy of the object.
| Code Block | ||||
|---|---|---|---|---|
| ||||
tomas.schmidl@secure.clevermaps.io/project:k5t8mf2a80tay2ng/dump:2020-06-23_17-48-00$ copyMetadata --objectName empty_indicator_drill --newName turnover_indicator_drill
Object turnover_value_indicator_drill.json successfully created as a copy of object empty_indicator_drill.json
|
Now, edit the business_overview_dashboard.json so that the turnover_indicator is paired with the new turnover_indicator_drill and use pushProject to push the changes.
| Code Block | ||
|---|---|---|
| ||
   ...
        "blockRows": [
            {
                "type": "indicator",
                "indicator": "/rest/projects/$projectId/md/indicators?name=turnover_indicator",
                "indicatorDrill": "/rest/projects/$projectId/md/indicatorDrills?name=turnover_indicator_drill",
                "layout": "primary"
            },
... |
| Info |
|---|
All the remaining indicators will still be paired with the For our use case in this tutorial, we will not do this. |
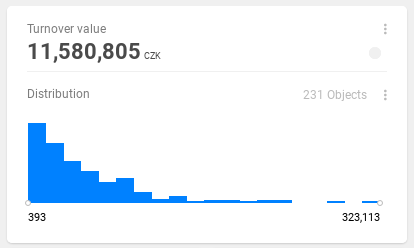
Distribution block
The content of turnover_indicator_drill is still empty so far.
Add a distribution block and push the changes. This block tells you the distribution of data across the map.
| Code Block | ||
|---|---|---|
| ||
{
    "id": "vgp4kn2foljcec5r",
    "name": "turnover_indicator_drill",
    "type": "indicatorDrill",
    "content": {
        "blocks": [
            {
                "type": "distribution",
                "onDashboard": true
            }
        ]
    },
    "accessInfo": {
        "createdAt": "2020-06-29T13:49:06Z",
        "modifiedAt": "2020-06-30T08:18:22Z",
        "createdBy": "/rest/accounts/00ubfu7fdyIoFKxXm0h7",
        "modifiedBy": "/rest/accounts/00ubfu7fdyIoFKxXm0h7"
    },
    "links": [
        {
            "rel": "self",
            "href": "/rest/projects/k5t8mf2a80tay2ng/md/indicatorDrills/vgp4kn2foljcec5r"
        }
    ]
} |
The distribution block has now appeared in the indicator drill.
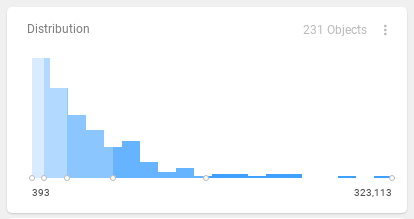
This block has the onDashboard property set to true, which means it will also be present on dashboard! This is another addition which can help you spice up your dashboard.
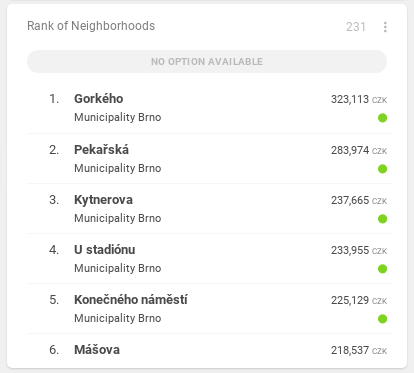
Ranking block
Add a ranking block and push the object. This block orders all objects in the map based on the value of selected indicator.
| Code Block | ||
|---|---|---|
| ||
{
    "id": "vgp4kn2foljcec5r",
    "name": "turnover_indicator_drill",
    "type": "indicatorDrill",
    "content": {
        "blocks": [
            {
                "type": "distribution",
                "onDashboard": true
            },
            {
                "type": "ranking"
            }
        ]
    },
    "accessInfo": {
        "createdAt": "2020-06-29T13:49:06Z",
        "modifiedAt": "2020-06-30T08:18:22Z",
        "createdBy": "/rest/accounts/00ubfu7fdyIoFKxXm0h7",
        "modifiedBy": "/rest/accounts/00ubfu7fdyIoFKxXm0h7"
    },
    "links": [
        {
            "rel": "self",
            "href": "/rest/projects/k5t8mf2a80tay2ng/md/indicatorDrills/vgp4kn2foljcec5r"
        }
    ]
} |
The ranking block has now appeared in the indicator drill.
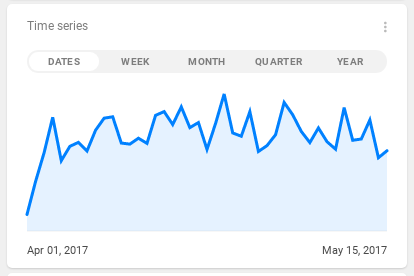
Time series block
Add a time series block and push the object. This block allows you to see the progress and trend of an indicator in a selected time frame.
| Code Block | ||
|---|---|---|
| ||
{
    "id": "vgp4kn2foljcec5r",
    "name": "turnover_indicator_drill",
    "type": "indicatorDrill",
    "content": {
        "blocks": [
            {
                "type": "distribution",
                "onDashboard": true
            },
            {
                "type": "ranking"
            },
            {
                "type": "timeSeries"
            }
        ]
    },
    "accessInfo": {
        "createdAt": "2020-06-29T13:49:06Z",
        "modifiedAt": "2020-06-30T08:18:22Z",
        "createdBy": "/rest/accounts/00ubfu7fdyIoFKxXm0h7",
        "modifiedBy": "/rest/accounts/00ubfu7fdyIoFKxXm0h7"
    },
    "links": [
        {
            "rel": "self",
            "href": "/rest/projects/k5t8mf2a80tay2ng/md/indicatorDrills/vgp4kn2foljcec5r"
        }
    ]
} |
The time series block has now appeared in the indicator drill.
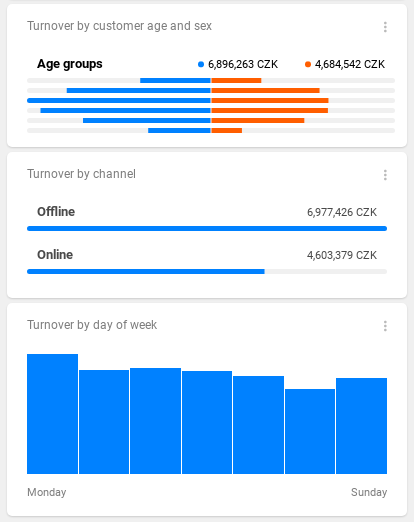
Categories block
The categories block allows you to list specific classes of data within a single indicator. It offers more configuration than the other blocks and can have many varieties.
We will add 3 different categories blocks to explore the possibilities.
...
| Code Block |
|---|
{
    "type": "categories",
    "title": "Turnover by customer age and sex",
    "description": "Turnover by customer age and sex",
    "splitProperty": "customers.age_group",
    "orderBy": {
        "property": "customers.age_group",
        "direction": "asc"
    },
    "dualProperty": "customers.sex",
    "label": "Age groups"
} |
| Code Block |
|---|
{
    "type": "categories",
    "title": "Turnover by channel",
    "description": "Turnover by channel",
    "splitProperty": "transactions.channel"
} |
| Code Block |
|---|
{
    "type": "categories",
    "title": "Turnover by day of week",
    "description": "Turnover by day of week",
    "splitProperty": "transactions.day_name",
    "orderBy": {
        "property": "transactions.day_index",
        "direction": "asc"
    },
    "vertical": true
} |
In all cases, a splitProperty (property by which data will be split), title and description must be specified.
- in case of age pyramid - we have to add
dualProperty, and alabel - in case of basic categories - we will not extend the object, but it's possible to make it e.g. condensed by setting the
condensedproperty to true - in case of vertical categoreis - we have to set the
verticalproperty to true
| Code Block | ||
|---|---|---|
| ||
{
    "id": "vgp4kn2foljcec5r",
    "name": "turnover_indicator_drill",
    "type": "indicatorDrill",
    "content": {
        "blocks": [
            {
                "type": "distribution",
                "onDashboard": true
            },
            {
                "type": "ranking"
            },
            {
                "type": "timeSeries"
            },
            {
                "type": "categories",
                "title": "Turnover by customer age and sex",
                "description": "Turnover by customer age and sex",
                "splitProperty": "customers.age_group",
                "orderBy": {
                    "property": "customers.age_group",
                    "direction": "asc"
                },
                "dualProperty": "customers.sex",
                "label": "Age groups"
            },
            {
                "type": "categories",
                "title": "Turnover by channel",
                "description": "Turnover by channel",
                "splitProperty": "transactions.channel"
            },
            {
                "type": "categories",
                "title": "Turnover by day of week",
                "description": "Turnover by day of week",
                "splitProperty": "transactions.day_name",
                "orderBy": {
                    "property": "transactions.day_index",
                    "direction": "asc"
                },
                "vertical": true
            }
        ]
    },
    "accessInfo": {
        "createdAt": "2020-06-29T13:49:06Z",
        "modifiedAt": "2020-06-30T08:18:22Z",
        "createdBy": "/rest/accounts/00ubfu7fdyIoFKxXm0h7",
        "modifiedBy": "/rest/accounts/00ubfu7fdyIoFKxXm0h7"
    },
    "links": [
        {
            "rel": "self",
            "href": "/rest/projects/k5t8mf2a80tay2ng/md/indicatorDrills/vgp4kn2foljcec5r"
        }
    ]
} |
The categories blocks have now appeared in the indicator drill.
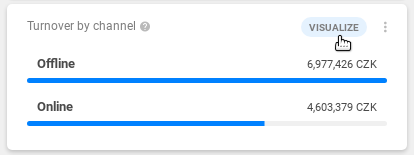
Qualitative visualization
You may have noticed that a Visualize icon appears when you hover the basic categories or vertical categories. This icon enables the qualitative visualization.
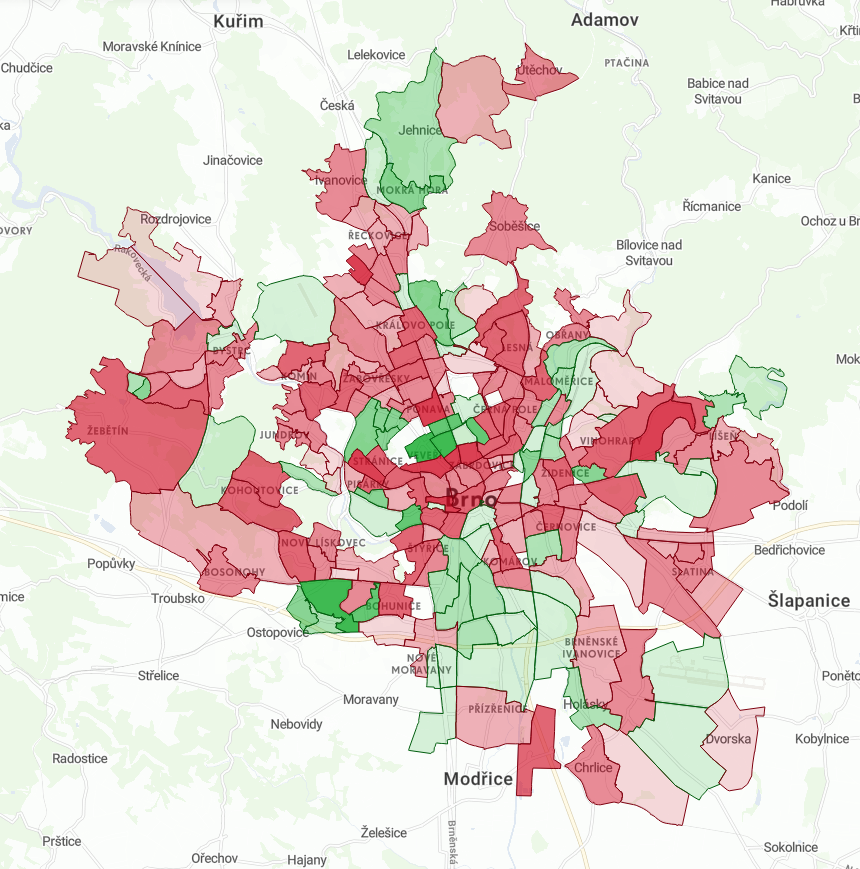
Qualitative visualization allows you to colorize objects on the map with a set of predefined colors, based on prevailing category of this object. The object can be an area, grid, zone, line, or a dot.
Some colors are assigned by default. In case of our project, we'll set up the areas with prevailing Online channel to be visualized as green, and Offline as red. The setting is done in the dwh.ref.properties.displayOptions object of the dataset property specified in the splitProperty of the categories block. You can pick any color you like from the given palette (purple, green, orange, blue, turquoise, pink, red, lime and brown).
| Code Block | ||
|---|---|---|
| ||
    ...
{
    "filterable": true,
    "name": "channel",
    "title": "Channel (online/offline)",
    "column": "channel",
    "type": "string",
    "displayOptions": {
        "valueOptions": [
            {
                "value": "Online",
                "color": "green"
            },
            {
                "value": "Offline",
                "color": "red"
            }
        ]
    }
},
... |
| Info |
|---|
If you want the qualitative visualization to be active directly after entering the view, set the |
Click on the Visualize icon and the map will become colorized.
| Info | ||||||||
|---|---|---|---|---|---|---|---|---|
| ||||||||
| Panel | ||||||||
| ||||||||
The content you are trying to reach has been moved here: https://docs.clevermaps.io/docs/tutorial-5-drilling-down-on-the-dataWe are proud to announce that we have launched a new documentation. Please update your saved links and bookmarks to follow a new address docs.clevermaps.io. |