An indicator drill allows you to further analyse an indicator. Indicator drill consists of an array of blocks. These blocks can be displayed either after clicking on an indicator, or directly on a dashboard.
There are 4 types of blocks:
distribution- adjust the distribution of data across the mapranking- order all relevant objects based on the value of selected indicatortimeSeries- see the progress and trend of an indicator in a selected time framecategories- list specific classes of data within a single indicator
| Info |
|---|
See the indicator drill blocks in action in the Features Catalog for Developers project. |
Syntax
This is an indicator drill which belongs to the Number of Customers indicator from the Retail Solution Demo. It contains all four available block types.
| Code Block | ||
|---|---|---|
| ||
{
    "name": "customers_indicator_drill",
    "type": "indicatorDrill",
    "content": {
        "blocks": [
            {
                "type": "distribution"
            },
            {
                "type": "ranking"
            },
            {
                "type": "timeSeries"
            },
            {
                "type": "categories",
                "title": "Customers by channel",
                "description": "Customers by channel",
                "splitProperty": "baskets.on_off_name",
                "orderBy": {
                    "property": "baskets.on_off_name",
                    "direction": "desc"
                }
            },
            {
                "type": "categories",
                "title": "Customers by age and sex",
                "description": "Customers by age and sex categories",
                "splitProperty": "clients.age_name",
                "orderBy": {
                   "property": "clients.age_cat",
                   "direction": "asc"
                },
                "dualProperty": "clients.sex_name",
                "label": "Age categories"
            }
        ]
    }
}
|
| Code Block | ||||
|---|---|---|---|---|
| ||||
{
    "url": "/rest/projects/yufqzxkbiecj7jot/md/indicatorDrills/t45dd93ksm4jshrs",
    "dumpTime": "2018-01-31T17:39:08Z",
    "version": "4",
    "content": {
        "id": "t45dd93ksm4jshrs",
        "name": "customers_indicator_drill",
        "type": "indicatorDrill",
        "content": {
            "blocks": [
                {
                    "type": "distribution"
                },
                {
                    "type": "ranking"
                },
                {
                    "type": "timeSeries"
                },
                {
                    "type": "categories",
                    "title": "Customers by channel",
                    "description": "Customers by channel",
                    "splitProperty": "baskets.on_off_name",
                    "orderBy": {
                        "property": "baskets.on_off_name",
                        "direction": "desc"
                    }
                },
                {
                    "type": "categories",
                    "title": "Customers by age and sex",
                    "description": "Customers by age and sex categories",
                    "splitProperty": "clients.age_name",
                    "orderBy": {
                        "property": "clients.age_cat",
                        "direction": "asc",
                        "sort": "asc"
                    },
                    "dualProperty": "clients.sex_name",
                    "label": "Age categories"
                }
            ]
        },
        "accessInfo": {
            "createdAt": "2017-10-05T08:27:04Z",
            "modifiedAt": "2018-01-31T16:39:10Z"
        },
        "links": [
            {
                "rel": "self",
                "href": "/rest/projects/yufqzxkbiecj7jot/md/indicatorDrills/t45dd93ksm4jshrs"
            }
        ]
    }
}
|
Additional syntax examples
| Code Block | ||||
|---|---|---|---|---|
| ||||
{
    "name": "turnover_value_indicator_drill",
    "type": "indicatorDrill",
    "content": {
        "blocks": [
            {
                "type": "distribution",
                "onDashboard": true
            },
            {
                "type": "ranking"
            },
            {
                "type": "timeSeries"
            }
        ]
    }
}
|
It is possible to display any block directly on a dashboard by setting the onDashboard property to true (see examples below). The block will be accessible and controllable without having to drill down on the indicator.
Please note that:
- it is possible to display only one block from each drill
- in case of the
distributionblock,histogramfilter is displayed instead
| Code Block | ||||
|---|---|---|---|---|
| ||||
{
    "name": "offline_turnover_indicator_drill",
    "type": "indicatorDrill",
    "content": {
        "blocks": [
            {
                "type": "timeSeries",
                "additionalSeries": [
                    {
                        "indicator": "/rest/projects/$projectId/md/indicators?name=online_turnover_indicator"
                    }
                ],
                "annotations": [
                    {
                        "dataset": "/rest/projects/$projectId/md/datasets?name=events"
                    }
                ]
            }
        ]
    }
}
|
It is possible to extend the timeSeries block with additional time series. In this example, we are comparing the offline and offline turnover, as you can see in the additionalSeries array, which contains a link to the online_turnover_indicator object.
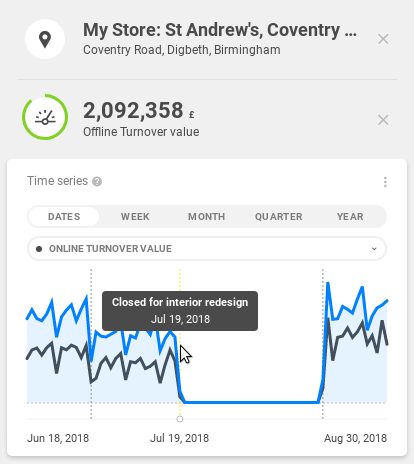
Additionally, it is possible to add annotations. Annotations are basically events that can be displayed in the timeSeries graph. The data for annotations are stored in a specific date subtype dataset, named e.g. "events". This dataset must contain a foreign key property containing id of the object to which the event relates to - in this case shops. It also must be linke to the dim_dates dataset of the date dimension, and contain a description of the event (which also must be in the featureTitle property). The visual representation of such timeSeries block can be found below.
| Code Block | ||||
|---|---|---|---|---|
| ||||
{
    "name": "events",
    "type": "dataset",
    "title": "Events",
    "properties": {
        "featureTitle": {
            "type": "property",
            "value": "description"
        }
    },
    "ref": {
        "type": "dwh",
        "subtype": "date",
        "table": "events",
        "primaryKey": "id",
        "categorizable": false,
        "fullTextIndex": false,
        "properties": [
            {
                "filterable": false,
                "name": "id",
                "title": "Id",
                "column": "id",
                "type": "integer"
            },
            {
                "filterable": false,
                "name": "shop_id",
                "title": "Shop id",
                "column": "shop_id",
                "type": "integer",
                "foreignKey": "shops"
            },
            {
                "filterable": false,
                "name": "date_iso",
                "title": "Date iso",
                "column": "date_iso",
                "type": "date",
                "foreignKey": "dim_dates"
            },
            {
                "filterable": false,
                "name": "description",
                "title": "Description",
                "column": "description",
                "type": "string"
            }
        ]
    }
}
|
| Code Block | ||||||
|---|---|---|---|---|---|---|
| ||||||
id,shop_id,date_iso,description
1,10,2018-07-01,Shortened opening hours
2,10,2018-07-19,Closed for interior redesign
3,10,2018-08-17,Shop opened again
|
Key description
content
...
| Status | ||||
|---|---|---|---|---|
|
...
an array of blocks
content.blocks.distribution
Distribution block's scale and the distribution of the data is defined in its paired indicator.content.
Distribution also has a description, which is not configurable through metadata, but is compiled from the properties of its paired indicator, according to this formula: "Distribution of indicator.title in granularity"
...
| Status | ||||
|---|---|---|---|---|
|
...
type identifier, always distribution
...
| Status | ||||
|---|---|---|---|---|
|
...
content.blocks.ranking
Ranking block can be switched to display either markers, or areas (when they're both available in the view). When there is a higher number of elements, infinite scroll is used.
Ranking also has a description, which is not configurable through metadata, but is compiled from the properties of its paired indicator, according to this formula: "Rank of object according to indicator.title" (note: object in this case is either a polygon from a certain granularity, or a marker).
...
| Status | ||||
|---|---|---|---|---|
|
...
type identifier, always ranking
...
| Status | ||||
|---|---|---|---|---|
|
...
| Status | ||||
|---|---|---|---|---|
|
...
specifies which feature type should be ranked by default
default = granularity
...
| Status | ||||
|---|---|---|---|---|
|
...
specifies the direction of ranked objects
default = desc
...
content.blocks.timeSeries
Time series visualises the progress and trend of the respective indicator in a selected time frame. Additionally, it can be extended with time series of another indicator.
However, its time frame is set by view.content.filterGroup.globalDate filter. The component itself also allows the user to set the granularity of the block (days, weeks, months, quarters or years).
Time series also has a description, which is not configurable through metadata, but is compiled from the properties of its paired indicator, according to this formula: "Progress of indicator.title from view.content.filterGroup.globalDate.startDate to view.content.filterGroup.globalDate.endDate"
...
| Status | ||||
|---|---|---|---|---|
|
...
type identifier, always timeSeries
...
| Status | ||||
|---|---|---|---|---|
|
...
| Status | ||||
|---|---|---|---|---|
|
...
| Status | ||||
|---|---|---|---|---|
|
...
| Status | ||||
|---|---|---|---|---|
|
...
content.blocks.timeSeries.additionalSeries
Contains link to an additional time series indicator. See the syntax example above.
...
| Status | ||||
|---|---|---|---|---|
|
...
URL link to the indicator object
...
content.blocks.timeSeries.annotations
Contains link to a dataset with annotation data. See the syntax example above.
...
| Status | ||||
|---|---|---|---|---|
|
...
URL link to the dataset object
...
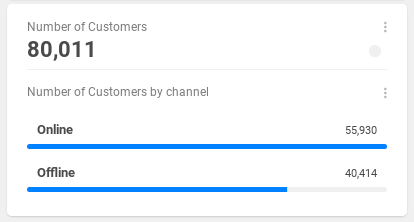
content.blocks.categories
Categories block list specific classes of data. The data are broke down to a categories defined by a splitProperty. These categories are filterable. The title and description of the categories can be set.
The categories are sorted based on their value, unless you specify custom ordering using orderBy. For example - we want categories with days of the week, sorted correctly. In that case, splitProperty will be the day name, and orderBy.property will be a property with integer value for each day.
This block also offers additional configuration, which allows it to be either condensed, or dual.
...
| Status | ||||
|---|---|---|---|---|
|
...
type identifier, always categories
...
| Status | ||||
|---|---|---|---|---|
|
...
| Status | ||||
|---|---|---|---|---|
|
...
| Status | ||||
|---|---|---|---|---|
|
...
| Status | ||||
|---|---|---|---|---|
|
...
URL link to the indicator object
![]() in case the block should not drill its paired indicator from the dashboard
in case the block should not drill its paired indicator from the dashboard
...
| Status | ||||
|---|---|---|---|---|
|
...
| Status | ||||
|---|---|---|---|---|
|
...
| Status | ||||
|---|---|---|---|---|
|
...
| Status | ||||
|---|---|---|---|---|
|
...
flag that allows you to turn off the default filterability
if not present, the block is filterable, must be set to false to turn it off
...
| Status | ||||
|---|---|---|---|---|
|
...
determines if the block should display categories with null or zero values
default = false
...
| Status | ||||
|---|---|---|---|---|
|
...
| Status | ||||
|---|---|---|---|---|
|
...
specifies ordering of the properties in the block
![]() if
if orderBy is not specified, the categories are ranked by the indicator value
see content.filterGroup.multiSelect.orderBy
...
displayValues
...
| Status | ||||
|---|---|---|---|---|
|
...
| Status | ||||
|---|---|---|---|---|
|
...
determines if the block should be vertical
![]() doesn't work with
doesn't work with condensed, dualProperty and label properties
...
| Status | ||||
|---|---|---|---|---|
|
...
determines if the block should appear as condensed or not
![]() see visual representation below
see visual representation below
...
| Status | ||||
|---|---|---|---|---|
|
...
identifier of a dataset property, by which the data will be dually split
![]() block with
block with dualProperty is always condensed = true
...
| Status | ||||
|---|---|---|---|---|
|
...
determines the default label of condensed categories
![]() it is not possible to set the
it is not possible to set the label for condensed = false block
...
Visual representation
Distribution block
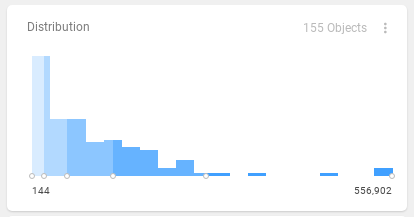
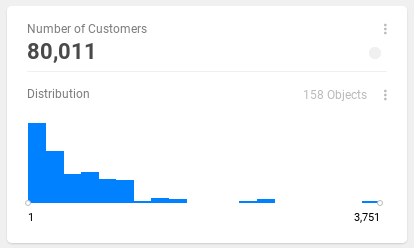
Distribution allows you to adjust the distribution of data across the map.
The data in the distribution block below are evenly distributed, and distinctively separate the areas of interest.
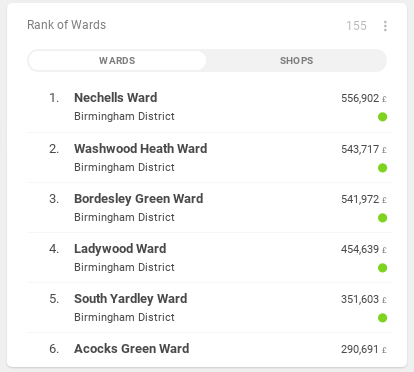
Ranking block
This block ranks areas by a specific indicator. In this case, it's the turnover value in Ward administrative units.
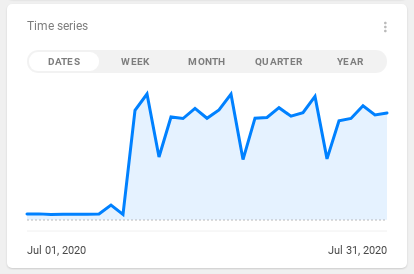
Time series block
Time series block shows progress and trend of a selected indicator over a specific period of time.
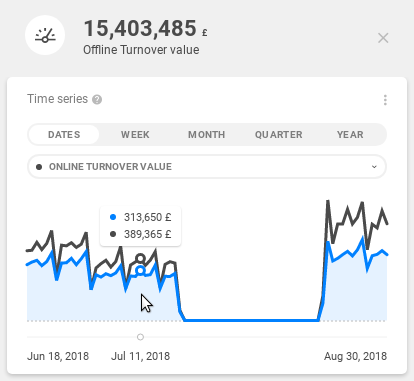
Time series block with additionalSeries
This block contains one additional indicator in the additionalSeries. It shows the comparison of offline (blue) and online (black) turnover. See the syntax example above.
If you specify more than one additional indicator, a dropdown menu with all other available indicators is displayed.
Time series block with additionalSeries and annotations
Events specified in the annotations array are related to a specific object - in this case a marker. So, note that to see them - we have to drill down on that specific marker. See the syntax example above.
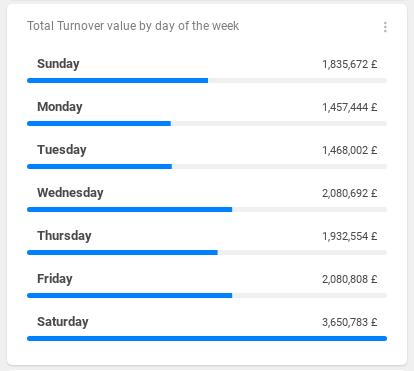
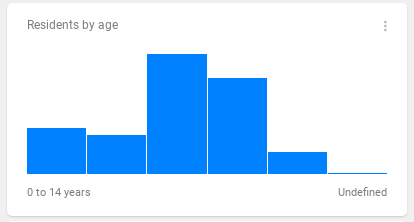
Categories block
Categories block lists specific classes of data.
This is a comparison of Total turnover by each day of the week.
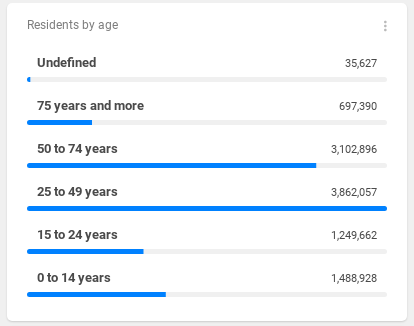
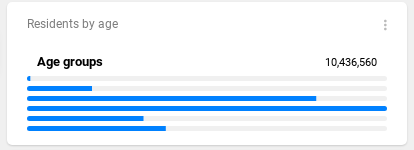
Categories also offers some additional configuration. It is possible to make the block condensed, or make it dually split (age pyramid). In condensed and dual mode, the detail of each category can be shown by hovering over it.
Please note, that the basic categories configuration is omitted in the snippets below. The splitProperty is set to demography_age_1.age_name, which defines the age categories.
...
| Code Block |
|---|
{
    ...
    "condensed": false
}
|
| Code Block |
|---|
{
    ...
    "condensed": true,
    "label": "Age groups"
}
|
...
...
...
| Code Block |
|---|
{
    ...
    "condensed": true,
    "dualProperty": "demography_age_1.sex",
    "label": "Age groups"
}
|
| Code Block |
|---|
{
    ...
    "vertical": true
}
|
...
Blocks on a dashboard
Available by setting the onDashboard property to true.
...
...
...
| Panel | ||||||||
|---|---|---|---|---|---|---|---|---|
| ||||||||
The content you are trying to reach has been moved here: https://docs.clevermaps.io/docs/indicator-drillsWe are proud to announce that we have launched a new documentation. Please update your saved links and bookmarks to follow a new address docs.clevermaps.io. |