Dashboard is an ordered list of indicators and indicator drill pairs.
Indicators on dashboard offer various ways of formatting. It's possible to group them, change their size or font, or display one of its indicator drill blocks directly on dashboard. They can also be collapsed or expanded (using right mouse click).
Dashboards are referenced in views. Each view references exactly one dashboard.
| Info |
|---|
See various setups of a dashboard in action in the Features Catalog for Developers project. |
Syntax
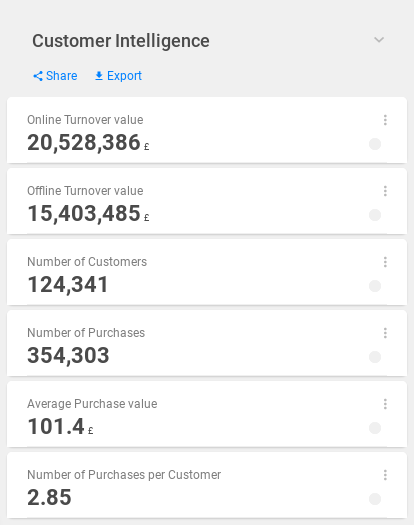
This is the syntax of the dashboard located in the Customer Intelligence view of the Retail Solution Demo project.
It's the simplest way to display an array of indicators. Each of them has one row and is primary. For more customized dashboards, see the syntax examples and visual representation below.
| Code Block | ||
|---|---|---|
| ||
{
    "name": "customer_intelligence_dashboard",
    "type": "dashboard",
    "content": {
        "blockRows": [
            {
                "type": "indicator",
                "indicator": "/rest/projects/$projectId/md/indicators?name=online_turnover_indicator",
                "indicatorDrill": "/rest/projects/$projectId/md/indicatorDrills?name=online_turnover_indicator_drill",
                "layout": "primary"
            },
            {
                "type": "indicator",
                "indicator": "/rest/projects/$projectId/md/indicators?name=offline_turnover_indicator",
                "indicatorDrill": "/rest/projects/$projectId/md/indicatorDrills?name=offline_turnover_indicator_drill",
                "layout": "primary"
            },
            {
                "type": "indicator",
                "indicator": "/rest/projects/$projectId/md/indicators?name=customers_indicator",
                "indicatorDrill": "/rest/projects/$projectId/md/indicatorDrills?name=customers_indicator_drill",
                "layout": "primary"
            },
            {
                "type": "indicator",
                "indicator": "/rest/projects/$projectId/md/indicators?name=purchases_indicator",
                "indicatorDrill": "/rest/projects/$projectId/md/indicatorDrills?name=purchases_indicator_drill",
                "layout": "primary"
            },
            {
                "type": "indicator",
                "indicator": "/rest/projects/$projectId/md/indicators?name=average_purchase_indicator",
                "indicatorDrill": "/rest/projects/$projectId/md/indicatorDrills?name=average_purchase_indicator_drill",
                "layout": "primary"
            },
            {
                "type": "indicator",
                "indicator": "/rest/projects/$projectId/md/indicators?name=purchases_customer_indicator",
                "indicatorDrill": "/rest/projects/$projectId/md/indicatorDrills?name=purchases_customer_indicator_drill",
                "layout": "primary"
            }
        ]
    }
}
|
| Code Block | ||||
|---|---|---|---|---|
| ||||
{
    "url": "/rest/projects/yufqzxkbiecj7jot/md/dashboards/fbvund7hls1s5a5s",
    "dumpTime": "2018-01-25T14:19:34Z",
    "version": "0",
    "content": {
        "id": "fbvund7hls1s5a5s",
        "name": "customer_intelligence_dashboard",
        "type": "dashboard",
        "content": {
            "blockRows": [
                {
                    "type": "indicator",
                    "indicator": "/rest/projects/$projectId/md/indicators?name=online_turnover_indicator",
                    "indicatorDrill": "/rest/projects/$projectId/md/indicatorDrills?name=online_turnover_indicator_drill",
                    "layout": "primary"
                },
                {
                    "type": "indicator",
                    "indicator": "/rest/projects/$projectId/md/indicators?name=offline_turnover_indicator",
                    "indicatorDrill": "/rest/projects/$projectId/md/indicatorDrills?name=offline_turnover_indicator_drill",
                    "layout": "primary"
                },
                {
                    "type": "indicator",
                    "indicator": "/rest/projects/$projectId/md/indicators?name=customers_indicator",
                    "indicatorDrill": "/rest/projects/$projectId/md/indicatorDrills?name=customers_indicator_drill",
                    "layout": "primary"
                },
                {
                    "type": "indicator",
                    "indicator": "/rest/projects/$projectId/md/indicators?name=purchases_indicator",
                    "indicatorDrill": "/rest/projects/$projectId/md/indicatorDrills?name=purchases_indicator_drill",
                    "layout": "primary"
                },
                {
                    "type": "indicator",
                    "indicator": "/rest/projects/$projectId/md/indicators?name=average_purchase_indicator",
                    "indicatorDrill": "/rest/projects/$projectId/md/indicatorDrills?name=average_purchase_indicator_drill",
                    "layout": "primary"
                },
                {
                    "type": "indicator",
                    "indicator": "/rest/projects/$projectId/md/indicators?name=purchases_customer_indicator",
                    "indicatorDrill": "/rest/projects/$projectId/md/indicatorDrills?name=purchases_customer_indicator_drill",
                    "layout": "primary"
                }
            ]
        },
        "accessInfo": {
            "createdAt": "2017-10-05T08:27:11Z"
        },
        "links": [
            {
                "rel": "self",
                "href": "/rest/projects/yufqzxkbiecj7jot/md/dashboards/fbvund7hls1s5a5s"
            }
        ]
    }
}
|
Additional syntax examples
| Code Block | ||||
|---|---|---|---|---|
| ||||
{
    "name": "customer_intelligence_dashboard",
    "type": "dashboard",
    "content": {
        "blockRows": [
            {
                "type": "blockRow",
                "blocks": [
                    {
                        "type": "indicator",
                        "indicator": "/rest/projects/$projectId/md/indicators?name=online_turnover_indicator",
                        "indicatorDrill": "/rest/projects/$projectId/md/indicatorDrills?name=online_turnover_indicator_drill",
                        "layout": "primary"
                    },
                    {
                        "type": "indicator",
                        "indicator": "/rest/projects/$projectId/md/indicators?name=offline_turnover_indicator",
                        "indicatorDrill": "/rest/projects/$projectId/md/indicatorDrills?name=offline_turnover_indicator_drill",
                        "layout": "primary"
                    }
                ]
            },
            {
                "type": "blockRow",
                "blocks": [
                    {
                        "type": "indicator",
                        "indicator": "/rest/projects/$projectId/md/indicators?name=customers_indicator",
                        "indicatorDrill": "/rest/projects/$projectId/md/indicatorDrills?name=customers_indicator_drill",
                        "layout": "secondary"
                    },
                    {
                        "type": "indicator",
                        "indicator": "/rest/projects/$projectId/md/indicators?name=purchases_indicator",
                        "indicatorDrill": "/rest/projects/$projectId/md/indicatorDrills?name=purchases_indicator_drill",
                        "layout": "secondary"
                    }
                ]
            },
            {
                "type": "indicator",
                "indicator": "/rest/projects/$projectId/md/indicators?name=average_purchase_indicator",
                "indicatorDrill": "/rest/projects/$projectId/md/indicatorDrills?name=average_purchase_indicator_drill",
                "layout": "primary"
            },
            {
                "type": "indicator",
                "indicator": "/rest/projects/$projectId/md/indicators?name=purchases_customer_indicator",
                "indicatorDrill": "/rest/projects/$projectId/md/indicatorDrills?name=purchases_customer_indicator_drill",
                "layout": "secondary"
            }
        ]
    }
}
|
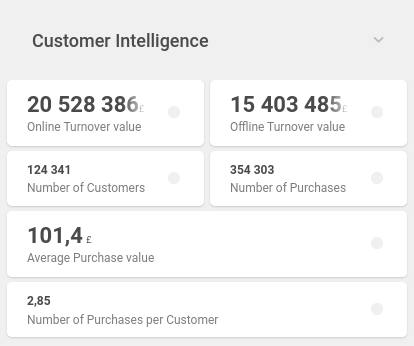
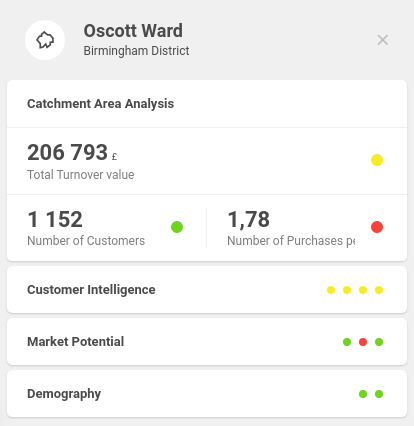
It is possible to split two indicators in half and display them in one row. This is a good way to squeeze more indicators on one dashboard.
To do that, we have to put them to the blockRow object. We have modified the dashboard from the main syntax example so that its first and second indicator are in a blockRow object, as well as the third and fourth indicator. Please note that a maximum of 2 indicators can be displayed in one row.
You can also notice that some of the indicators have secondary layout. Using this layout, the indicator tile and the font become smaller, allowing you to display yet more indicators on one dashboard. The two indicators in a blockRow should have identical layout, otherwise one tile will be larger than the other and the row will look weird.
-
| Code Block | ||||
|---|---|---|---|---|
| ||||
{
    "name": "indicator_groups_dashboard",
    "type": "dashboard",
    "content": {
        "blockRows": [
            {
                "type": "indicatorGroup",
                "title": "Catchment Area Analysis",
                "blockRows": [
                    {
                        "type": "indicator",
                        "indicator": "/rest/projects/$projectId/md/indicators?name=turnover_indicator",
                        "indicatorDrill": "/rest/projects/$projectId/md/indicatorDrills?name=turnover_indicator_drill",
                        "layout": "primary"
                    },
                    {
                        "type": "indicator",
                        "indicator": "/rest/projects/$projectId/md/indicators?name=customers_indicator",
                        "indicatorDrill": "/rest/projects/$projectId/md/indicatorDrills?name=customers_indicator_drill",
                        "layout": "primary"
                    },
                    {
                        "type": "indicator",
                        "indicator": "/rest/projects/$projectId/md/indicators?name=purchases_customer_indicator",
                        "indicatorDrill": "/rest/projects/$projectId/md/indicatorDrills?name=purchases_customer_indicator_drill",
                        "layout": "primary"
                    }
                ]
            },
            {
                "type": "indicatorGroup",
                "title": "Customer Intelligence",
                "blockRows": [
                    {
                        "type": "indicator",
                        "indicator": "/rest/projects/$projectId/md/indicators?name=online_turnover_indicator",
                        "indicatorDrill": "/rest/projects/$projectId/md/indicatorDrills?name=online_turnover_indicator_drill",
                        "layout": "primary"
                    },
                    {
                        "type": "indicator",
                        "indicator": "/rest/projects/$projectId/md/indicators?name=offline_turnover_indicator",
                        "indicatorDrill": "/rest/projects/$projectId/md/indicatorDrills?name=offline_turnover_indicator_drill",
                        "layout": "primary"
                    },
                    {
                        "type": "indicator",
                        "indicator": "/rest/projects/$projectId/md/indicators?name=purchases_indicator",
                        "indicatorDrill": "/rest/projects/$projectId/md/indicatorDrills?name=purchases_indicator_drill",
                        "layout": "primary"
                    },
                    {
                        "type": "indicator",
                        "indicator": "/rest/projects/$projectId/md/indicators?name=average_purchase_indicator",
                        "indicatorDrill": "/rest/projects/$projectId/md/indicatorDrills?name=average_purchase_indicator_drill",
                        "layout": "primary"
                    }
                ]
            },
            {
                "type": "indicatorGroup",
                "title": "Market Potential",
                "blockRows": [
                    {
                        "type": "indicator",
                        "indicator": "/rest/projects/$projectId/md/indicators?name=market_potential_indicator",
                        "indicatorDrill": "/rest/projects/$projectId/md/indicatorDrills?name=market_potential_indicator_drill",
                        "layout": "primary"
                    },
                    {
                        "type": "indicator",
                        "indicator": "/rest/projects/$projectId/md/indicators?name=market_penetration_indicator",
                        "indicatorDrill": "/rest/projects/$projectId/md/indicatorDrills?name=market_penetration_indicator_drill",
                        "layout": "primary"
                    },
                    {
                        "type": "indicator",
                        "indicator": "/rest/projects/$projectId/md/indicators?name=potential_customers_indicator",
                        "indicatorDrill": "/rest/projects/$projectId/md/indicatorDrills?name=potential_customers_indicator_drill",
                        "layout": "primary"
                    }
                ]
            },
            {
                "type": "indicatorGroup",
                "title": "Demography",
                "blockRows": [
                    {
                        "type": "indicator",
                        "indicator": "/rest/projects/$projectId/md/indicators?name=residents_indicator",
                        "indicatorDrill": "/rest/projects/$projectId/md/indicatorDrills?name=residents_indicator_drill",
                        "layout": "primary"
                    },
                    {
                        "type": "indicator",
                        "indicator": "/rest/projects/$projectId/md/indicators?name=households_indicator",
                        "indicatorDrill": "/rest/projects/$projectId/md/indicatorDrills?name=households_indicator_drill",
                        "layout": "primary"
                    }
                ]
            }
        ]
    }
}
|
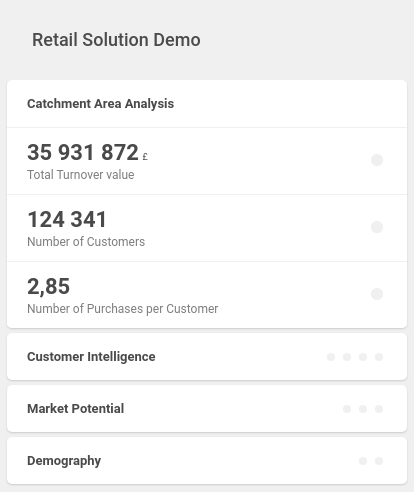
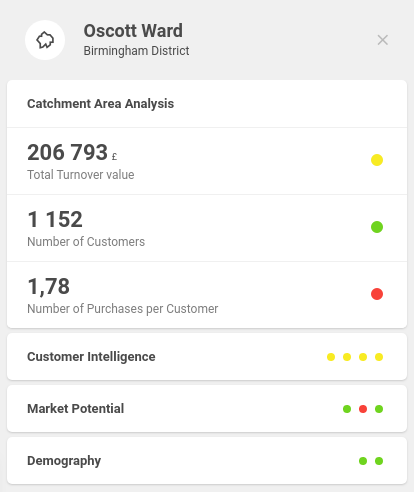
It is possible to group a number of indicators in an indicatorGroups array. This is a good way to display high number of indicators in a compact way.
This example shows the indicators from the first four views of the Retail Solution Demo grouped into one view's dashboard with indicatorGroups.
-
| Code Block | ||||
|---|---|---|---|---|
| ||||
{
    "name": "indicator_groups_dashboard",
    "type": "dashboard",
    "content": {
        "blockRows": [
            {
                "type": "indicatorGroup",
                "title": "Catchment Area Analysis",
                "blockRows": [
                    {
                        "type": "indicator",
                        "indicator": "/rest/projects/$projectId/md/indicators?name=turnover_indicator",
                        "indicatorDrill": "/rest/projects/$projectId/md/indicatorDrills?name=turnover_indicator_drill",
                        "layout": "primary"
                    },
                    {
                        "type": "blockRow",
                        "blocks": [
                            {
                                "type": "indicator",
                                "indicator": "/rest/projects/$projectId/md/indicators?name=customers_indicator",
                                "indicatorDrill": "/rest/projects/$projectId/md/indicatorDrills?name=customers_indicator_drill",
                                "layout": "primary"
                            },
                            {
                                "type": "indicator",
                                "indicator": "/rest/projects/$projectId/md/indicators?name=purchases_customer_indicator",
                                "indicatorDrill": "/rest/projects/$projectId/md/indicatorDrills?name=purchases_customer_indicator_drill",
                                "layout": "primary"
                            }
                        ]
                    }
                ]
            },
            {
                "type": "indicatorGroup",
                "title": "Customer Intelligence",
                "blockRows": [
                    {
                        "type": "blockRow",
                        "blocks": [
                            {
                                "type": "indicator",
                                "indicator": "/rest/projects/$projectId/md/indicators?name=online_turnover_indicator",
                                "indicatorDrill": "/rest/projects/$projectId/md/indicatorDrills?name=online_turnover_indicator_drill",
                                "layout": "primary"
                            },
                            {
                                "type": "indicator",
                                "indicator": "/rest/projects/$projectId/md/indicators?name=offline_turnover_indicator",
                                "indicatorDrill": "/rest/projects/$projectId/md/indicatorDrills?name=offline_turnover_indicator_drill",
                                "layout": "primary"
                            }
                        ]
                    },
                    {
                        "type": "blockRow",
                        "blocks": [
                            {
                                "type": "indicator",
                                "indicator": "/rest/projects/$projectId/md/indicators?name=purchases_indicator",
                                "indicatorDrill": "/rest/projects/$projectId/md/indicatorDrills?name=purchases_indicator_drill",
                                "layout": "primary"
                            },
                            {
                                "type": "indicator",
                                "indicator": "/rest/projects/$projectId/md/indicators?name=average_purchase_indicator",
                                "indicatorDrill": "/rest/projects/$projectId/md/indicatorDrills?name=average_purchase_indicator_drill",
                                "layout": "primary"
                            }
                        ]
                    }
                ]
            },
            {
                "type": "indicatorGroup",
                "title": "Market Potential",
                "blockRows": [
                    {
                        "type": "blockRow",
                        "blocks": [
                            {
                                "type": "indicator",
                                "indicator": "/rest/projects/$projectId/md/indicators?name=market_potential_indicator",
                                "indicatorDrill": "/rest/projects/$projectId/md/indicatorDrills?name=market_potential_indicator_drill",
                                "layout": "primary"
                            },
                            {
                                "type": "indicator",
                                "indicator": "/rest/projects/$projectId/md/indicators?name=market_penetration_indicator",
                                "indicatorDrill": "/rest/projects/$projectId/md/indicatorDrills?name=market_penetration_indicator_drill",
                                "layout": "primary"
                            }
                        ]
                    },
                    {
                        "type": "indicator",
                        "indicator": "/rest/projects/$projectId/md/indicators?name=potential_customers_indicator",
                        "indicatorDrill": "/rest/projects/$projectId/md/indicatorDrills?name=potential_customers_indicator_drill",
                        "layout": "primary"
                    }
                ]
            },
            {
                "type": "indicatorGroup",
                "title": "Demography",
                "blockRows": [
                    {
                        "type": "indicator",
                        "indicator": "/rest/projects/$projectId/md/indicators?name=residents_indicator",
                        "indicatorDrill": "/rest/projects/$projectId/md/indicatorDrills?name=residents_indicator_drill",
                        "layout": "primary"
                    },
                    {
                        "type": "indicator",
                        "indicator": "/rest/projects/$projectId/md/indicators?name=households_indicator",
                        "indicatorDrill": "/rest/projects/$projectId/md/indicatorDrills?name=households_indicator_drill",
                        "layout": "primary"
                    }
                ]
            }
        ]
    }
}
|
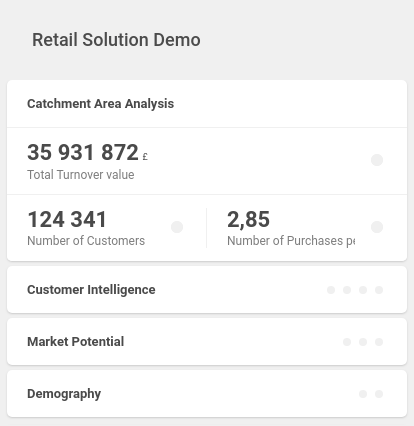
This example combines the use of indicatorGroups and blockRow objects.
| Code Block | ||||
|---|---|---|---|---|
| ||||
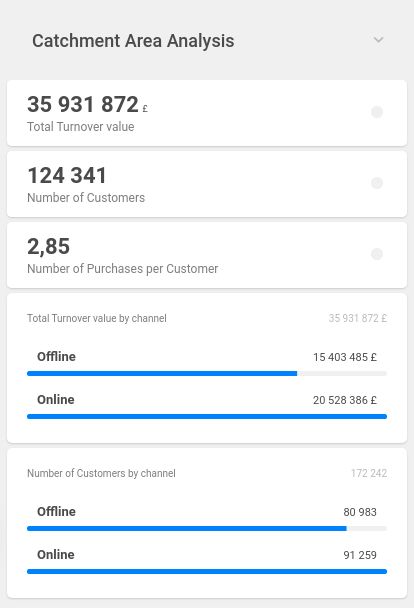
{
    "name": "catchment_area_dashboard",
    "type": "dashboard",
    "content": {
        "blockRows": [
            {
                "type": "indicator",
                "indicator": "/rest/projects/$projectId/md/indicators?name=turnover_indicator",
                "indicatorDrill": "/rest/projects/$projectId/md/indicatorDrills?name=turnover_indicator_drill",
                "layout": "primary"
            },
            {
                "type": "indicator",
                "indicator": "/rest/projects/$projectId/md/indicators?name=customers_indicator",
                "indicatorDrill": "/rest/projects/$projectId/md/indicatorDrills?name=customers_indicator_drill",
                "layout": "primary"
            },
            {
                "type": "indicator",
                "indicator": "/rest/projects/$projectId/md/indicators?name=purchases_customer_indicator",
                "indicatorDrill": "/rest/projects/$projectId/md/indicatorDrills?name=purchases_customer_indicator_drill",
                "layout": "primary"
            },
            {
                "type": "categories",
                "indicator": "/rest/projects/$projectId/md/indicators?name=turnover_indicator",
                "title": "Total Turnover value by channel",
                "description": "Total Turnover value by channel",
                "splitProperty": "baskets.on_off_name",
                "orderBy": {
                    "property": "baskets.on_off_name",
                    "direction": "asc"
                }
            },
            {
                "type": "categories",
                "indicator": "/rest/projects/$projectId/md/indicators?name=customers_indicator",
                "title": "Number of Customers by channel",
                "description": "Number of Customers by channel",
                "splitProperty": "baskets.on_off_name",
                "orderBy": {
                    "property": "baskets.on_off_name",
                    "direction": "asc"
                }
            }
        ]
    }
}
|
It is possible to display the categories block (from indicator drill) directly on a dashboard. In that case, a block with corresponding indicator must be specified. For the block description, see content.blocks.categories.
| Code Block | ||||
|---|---|---|---|---|
| ||||
{
    "name": "catchment_area_dashboard",
    "type": "dashboard",
    "content": {
        "blockRows": [
            {
                "type": "indicator",
                "indicator": "/rest/projects/$projectId/md/indicators?name=turnover_indicator",
                "indicatorDrill": "/rest/projects/$projectId/md/indicatorDrills?name=turnover_indicator_drill",
                "layout": "primary"
            },
            {
                "type": "indicator",
                "indicator": "/rest/projects/$projectId/md/indicators?name=customers_indicator",
                "indicatorDrill": "/rest/projects/$projectId/md/indicatorDrills?name=customers_indicator_drill",
                "layout": "primary"
            },
            {
                "type": "indicator",
                "indicator": "/rest/projects/$projectId/md/indicators?name=purchases_customer_indicator",
                "indicatorDrill": "/rest/projects/$projectId/md/indicatorDrills?name=purchases_customer_indicator_drill",
                "layout": "primary"
            }
        ],
        "datasetProperties": [
            {
                "dataset": "/rest/projects/$projectId/md/datasets?name=shops",
                "featureAttributes": [
                    {
                        "type": "property",
                        "value": "manager_name"
                    },
                    {
                        "type": "property",
                        "value": "opening_hours"
                    },
                    {
                        "type": "property",
                        "value": "contact_phone"
                    },
                    {
                        "type": "property",
                        "value": "contact_mail",
                        "format": {
                            "type": "email"
                        }
                    },
                    {
                        "type": "property",
                        "value": "employees"
                    },
                    {
                        "type": "property",
                        "value": "monthly_rent",
                        "format": {
                            "type": "number",
                            "fraction": 0,
                            "symbol": "£"
                        }
                    }
                ]
            }
        ]
    }
}
|
It is also possible to define (but not display) the dataset.properties.featureAttributes on a dashboard. This way, attributes can be defined per view, in case you want to see the properties of a dataset in one view, but not the other. When defined in dataset, the attributes are active per the whole project.
Key description
content
...
| Status | ||||
|---|---|---|---|---|
|
...
array of either:
- indicator and indicator drill pairs
- a
blockRowobject containing a maximum of 2 indicator and indicator drill pairs in one line - an
indicatorGroupobject containing grouped indicator and indicator drill pairs - a categories indicator drill block
see the syntax examples above
...
| Status | ||||
|---|---|---|---|---|
|
...
definition of dataset's featureAttributes and defaultSearch per view options
content.blockRows.indicator
blockRows.indicatorA regular indicator tile in one row.
...
| Status | ||||
|---|---|---|---|---|
|
...
| Status | ||||
|---|---|---|---|---|
|
...
URL link to the indicator object
...
| Status | ||||
|---|---|---|---|---|
|
...
URL link to the indicator drill object
...
| Status | ||||
|---|---|---|---|---|
|
...
layout of the indicator
when not specified, the indicator's layout is primary
...
content.blockRows.blockRow
blockRows.blockRowAn object defining one row in a dashboard. Can contain a maximum of 2 indicators, which will be split in half and displayed in one row.
...
| Status | ||||
|---|---|---|---|---|
|
...
| Status | ||||
|---|---|---|---|---|
|
...
array of indicator and indicator drill pairs
...
content.blockRows.indicatorGroup
blockRows.A number of indicators in a named collapsible group.
...
| Status | ||||
|---|---|---|---|---|
|
...
| Status | ||||
|---|---|---|---|---|
|
...
| Status | ||||
|---|---|---|---|---|
|
...
| Status | ||||
|---|---|---|---|---|
|
...
| Status | ||||
|---|---|---|---|---|
|
...
array of either:
- indicator and indicator drill pairs
- a
blockRowobject containing a maximum of 2 indicator and indicator drill pairs in one line
see the syntax example above
content.blockRows.categories
blockRows.categoriesThe syntax of categories block on dashboard is identical to the regular categories syntax. See indicatorDrill.content.blocks.categories.
content.datasetProperties
datasetPropertiesAllows you to define dataset's featureAttributes on dashboard. See above.
...
| Status | ||||
|---|---|---|---|---|
|
...
| Status | ||||
|---|---|---|---|---|
|
...
specifies if the dataset will be enabled in Refine search
enable = dataset will be enabled
disable = dataset will be disabled
auto = dataset will be enabled if its features are visible in the map
...
| Status | ||||
|---|---|---|---|---|
|
...
array of dataset.properties.featureAttributes
Visual representation
Dashboard with blockRows
...
basic dashboard
...
with blockRow objects and secondary indicators
...
...
Dashboard with indicatorGroups
...
with indicatorGroups
...
with indicatorGroups and blockRow objects
...
...
...
...
Dashboard with indicator drill blocks
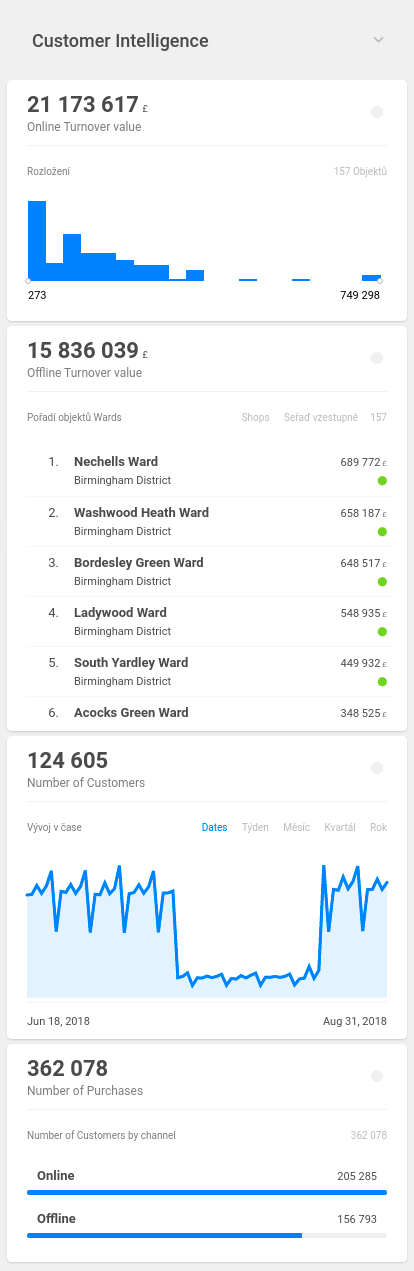
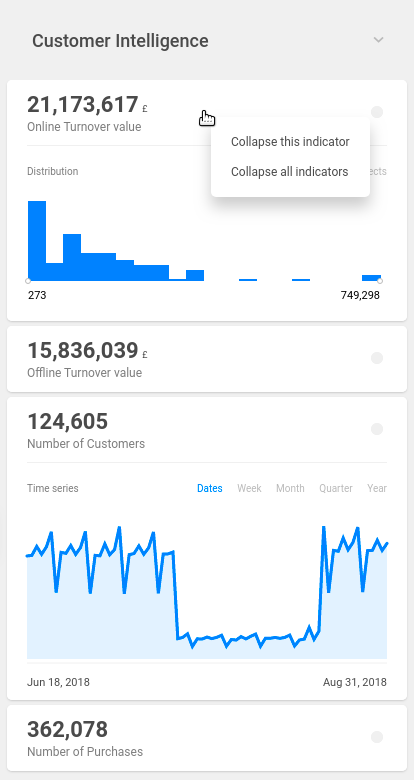
To display an indicator drill block directly on a dashboard, you can set its onDashboard property to true. It is possible to display all four blocks: distribution, ranking, timeSeries and categories.
Each block on a dashboard can be collapsed / expanded, by using the right click and selecting "Collapse this indicator" / "Expand this indicator".
...
indicator drill blocks onDashboard
...
block collapse / expand option
...
...
Dashboard with categories block
Each indicator can have one its blocks on dashboard. Apart from that, it's also possible to display categories blocks on their own.
Dashboard with combination of all features
This dashboard combines all features mentioned above: regular indicators, indicators with blocks onDashboard, indicators in blockRow objects, indicators in indicatorGroups and categories block on dashboard.
...
dashboard features mix
...
after clicking on an area
...
...
| Panel | ||||||||
|---|---|---|---|---|---|---|---|---|
| ||||||||
The content you are trying to reach has been moved here: https://docs.clevermaps.io/docs/dashboardsWe are proud to announce that we have launched a new documentation. Please update your saved links and bookmarks to follow a new address docs.clevermaps.io. |