2023-01-23
New features and improvements
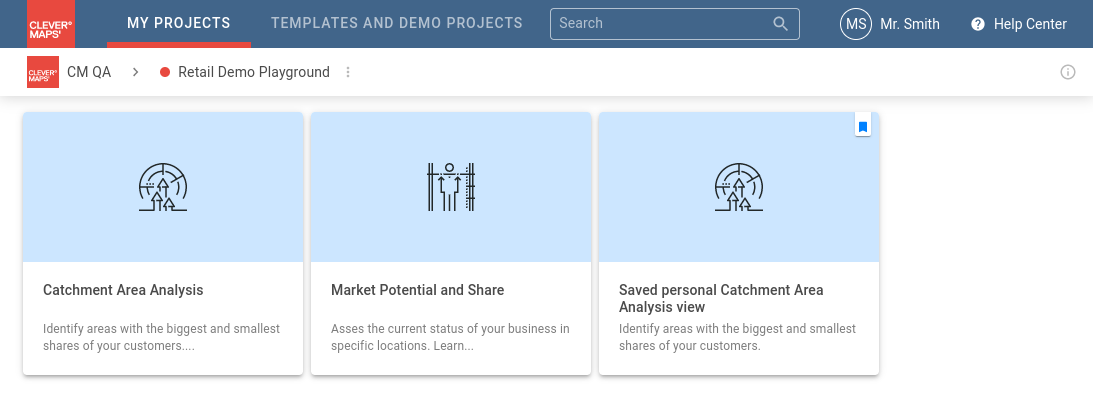
Introducing new kind of map view called Personal saved view. In contrast to standard Project-wide view it is displayed to on project page its creator only. It is still accessible to all project members via link though.
Add new property
defaultViewsin projectSettings metadata. All map Project-wide views meant for all project members must be included there. Otherwise view is considered as Saved personal view.Code Block { "name": "project_settings_template", "type": "projectSettings", "content": { "defaultViews": [ "/rest/projects/$projectId/md/views?name=catchment_area_view", "/rest/projects/$projectId/md/views?name=restaurants_rating_view" ] } }
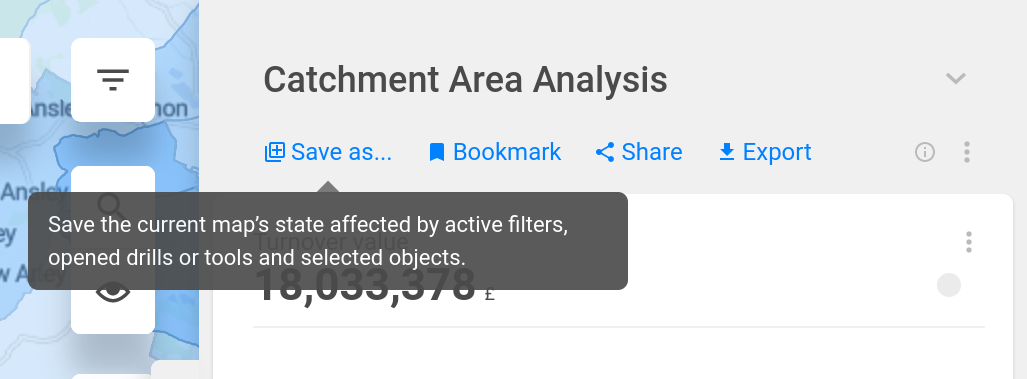
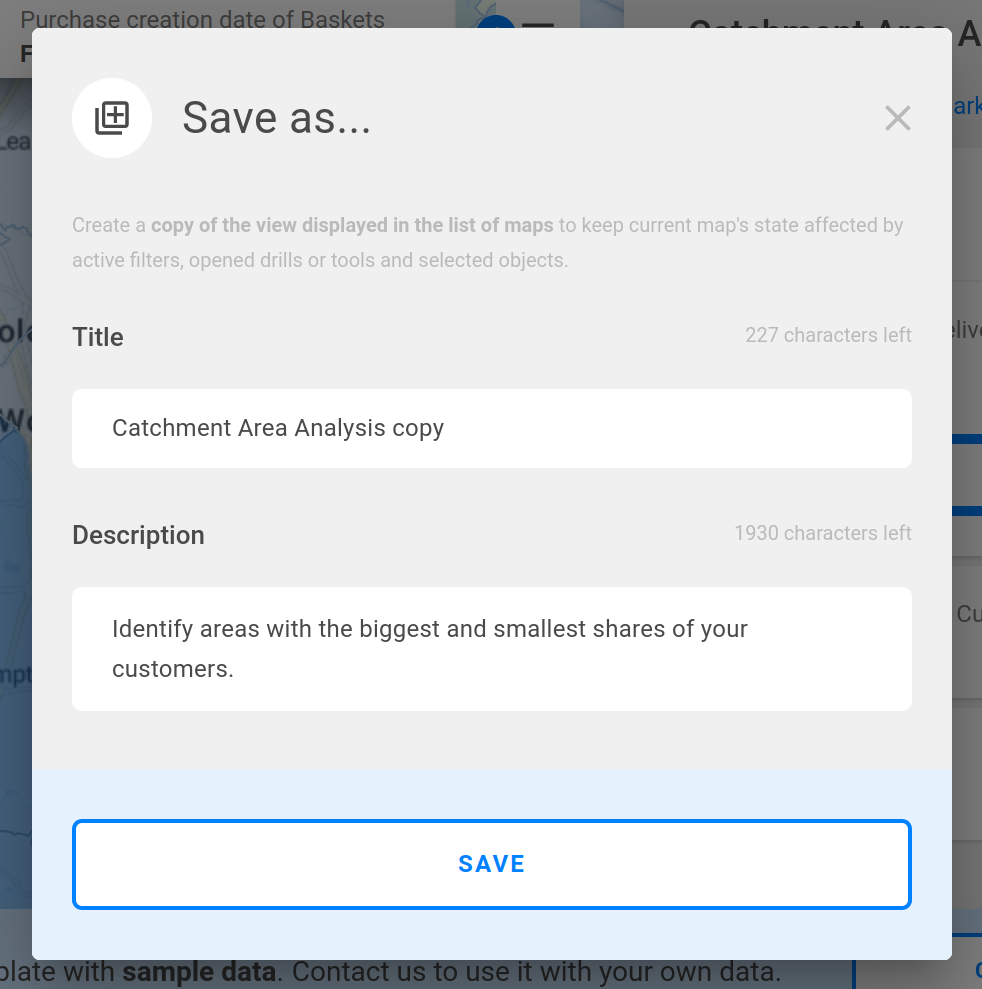
Add functionaliy Save as … to create Personal saved view including map and dashboard state.
Save as … functionality is accessible only for ADMIN and EDITOR members.
In contrast with share and bookmark functionality persisted state is reliable and is not damaged when original map view metadata is updated.
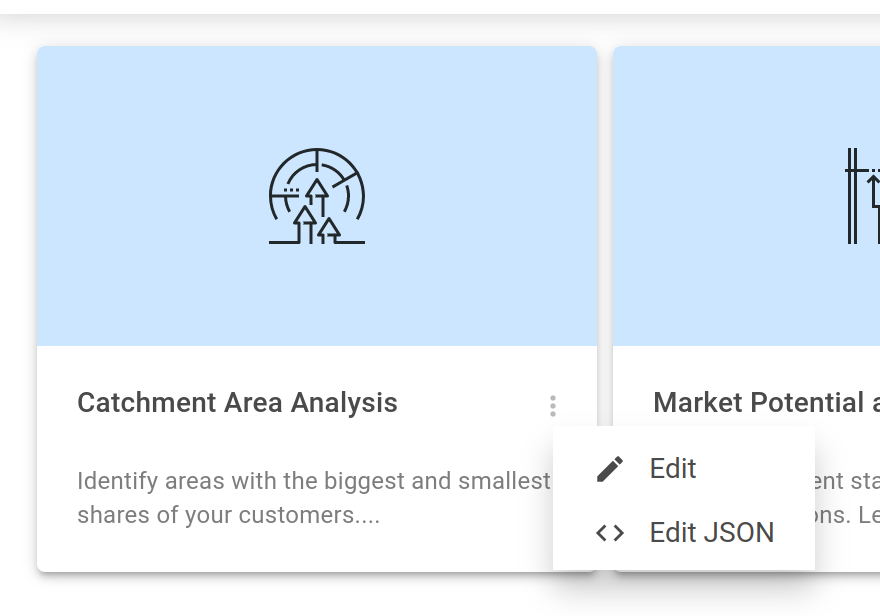
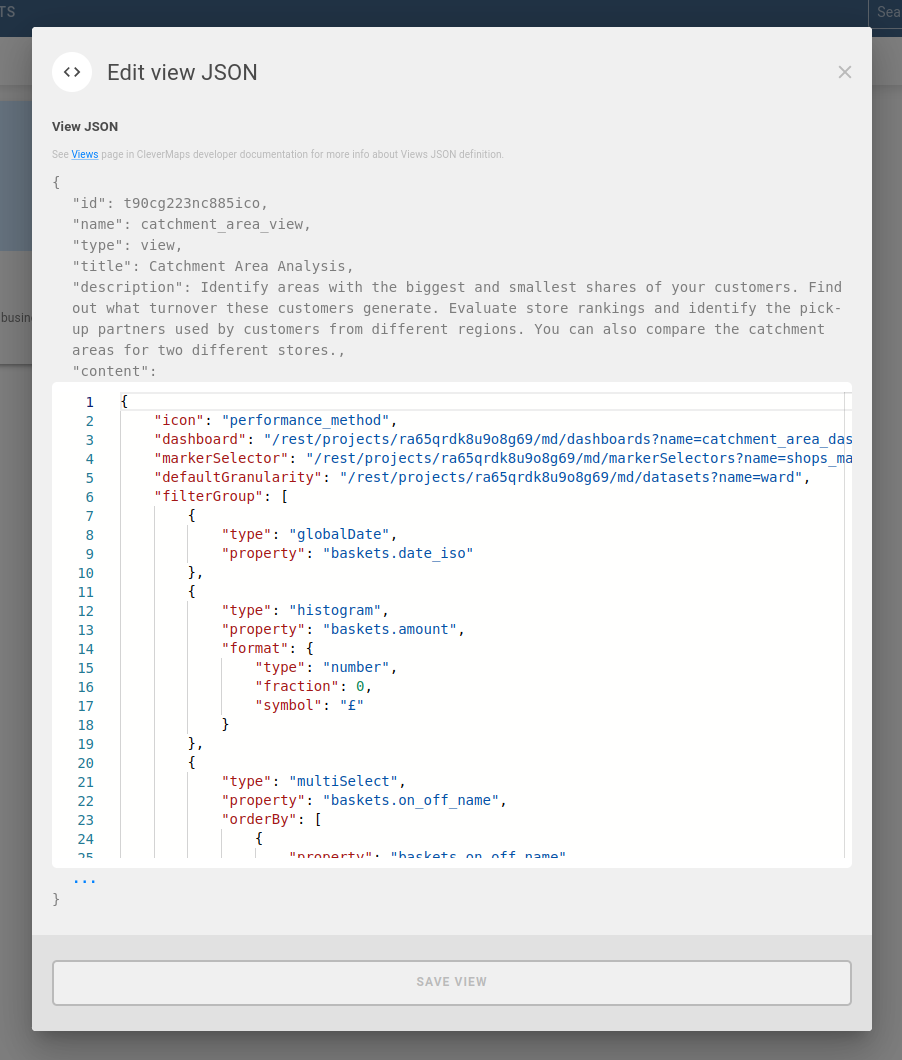
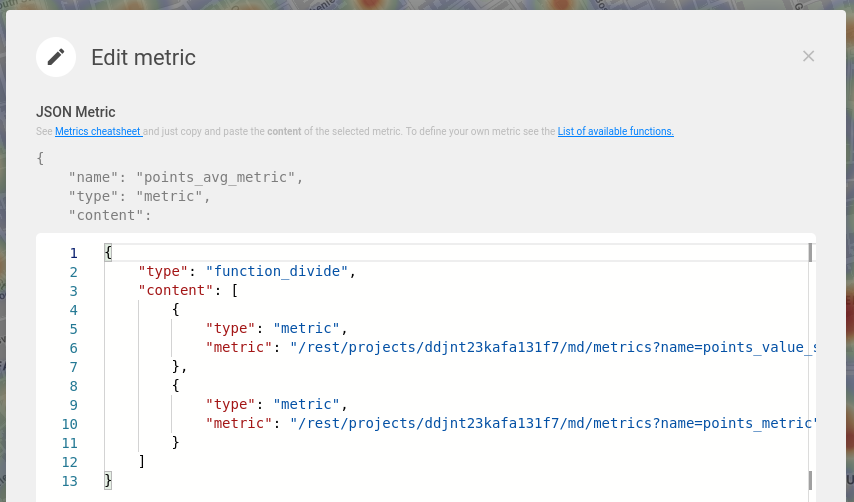
Allows to view and edit map view metadata JSON on UI. Only ADMIN and EDITOR roles are allowed to edit.
block.onDashboardfunctionality was removed after beeing deprecated for several months. Use blocks directly on dashboard instead.*.clevermap.io domain and all subdomains are allowed as Trusted origin of project by default.
Bugfixes
Fixes histogram labels (e.g. incorrectly mixed less than and less or equal than).
Fixes categories editation on UI.
Fixes showing indicator values in public projects.
Fixes
importProjecterror Specific key does not exist. Among other things, it fixes cloning of projects on UI.Fixes failing dwh queries caused by too long property ids.
Fixes displaying of blocks within indicator group.
Fixes order of number attribute values in multiselect filter, column and bar chart.
2022-11-27
New features and improvements
All drill blocks can be put under indicator directly on dashboard
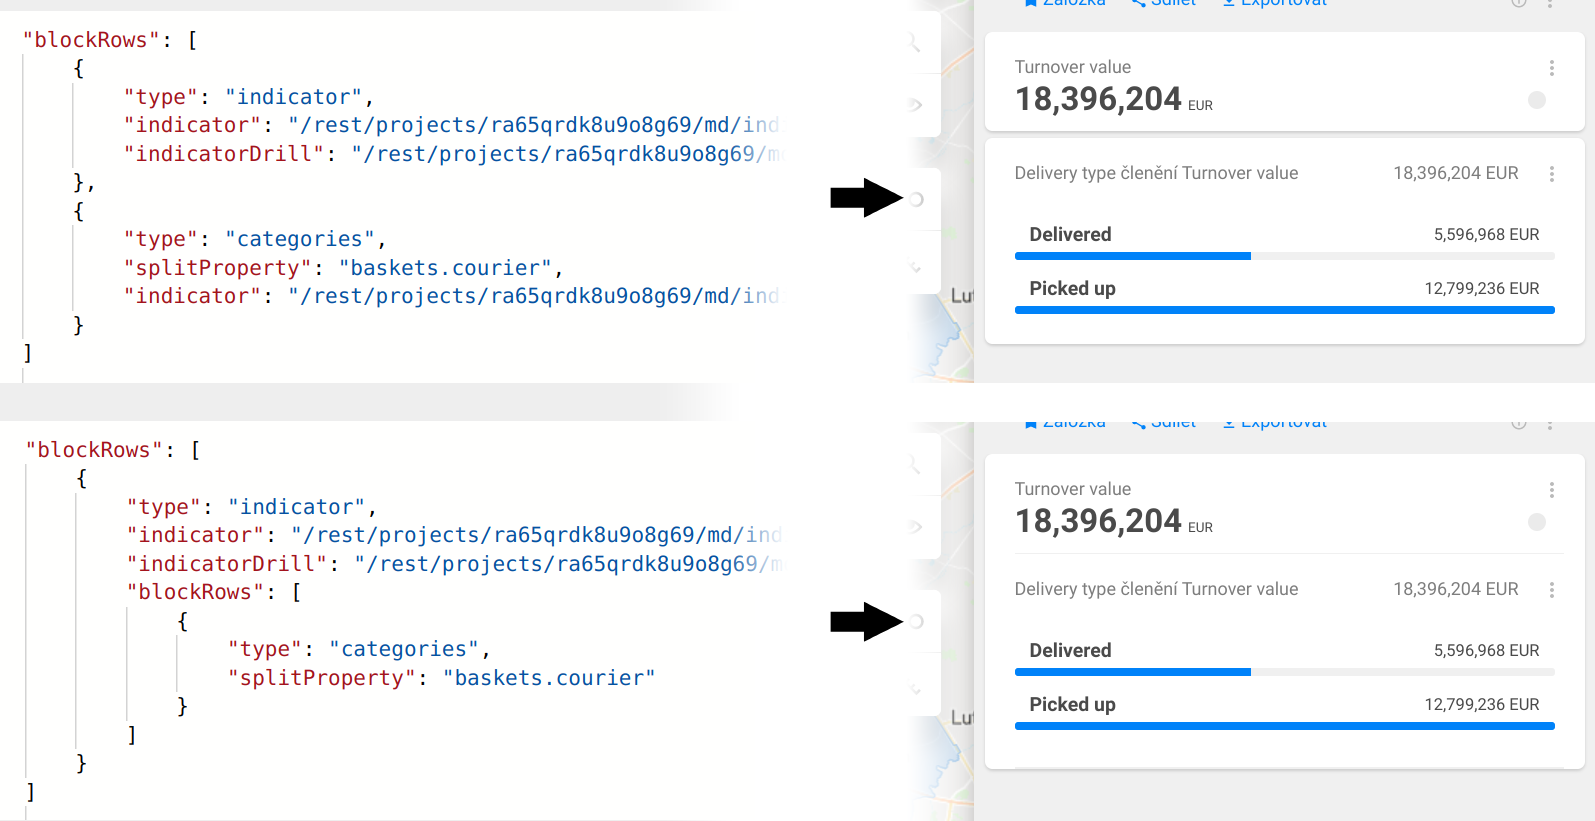
Drill blocks under indicator can be collapsed like rest of blocks
Metadata migration of drill block with onDashboard to drill blocks directly on dashboard under indicator

block.onDashboardfunctionality is considered deprecated and will be deleted soon. Do not use it anymore. Use blocks directly on dashboard.
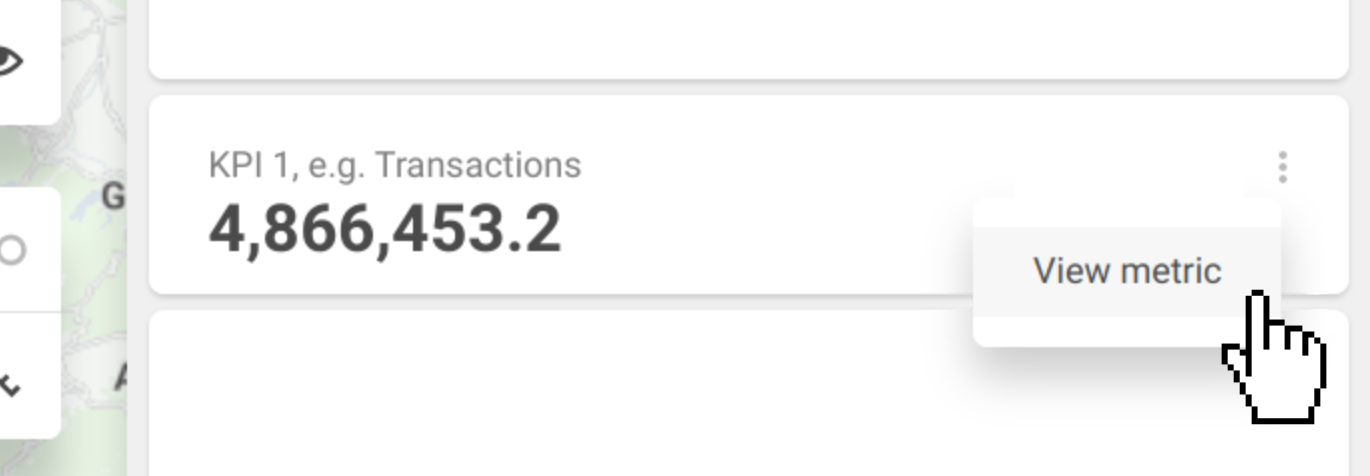
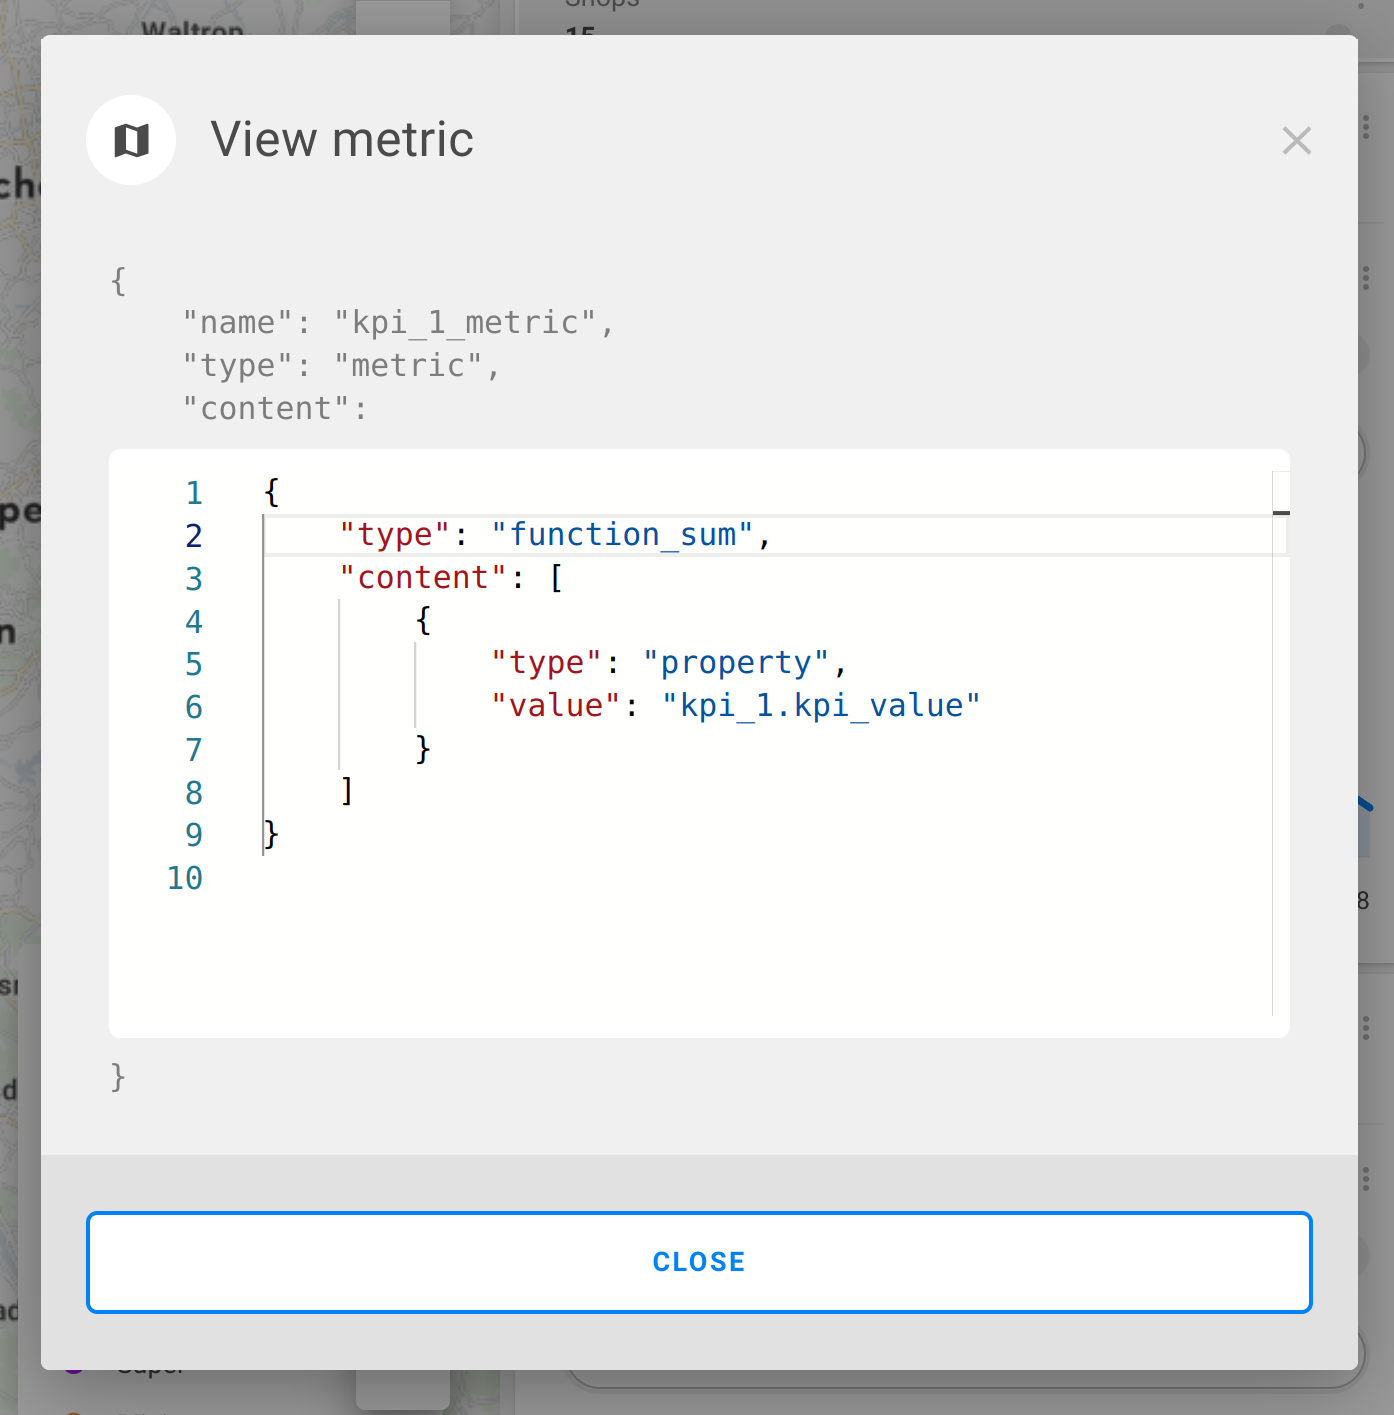
Viewer can show metric and dashboard metadata JSON definition
Improved condensed categories block
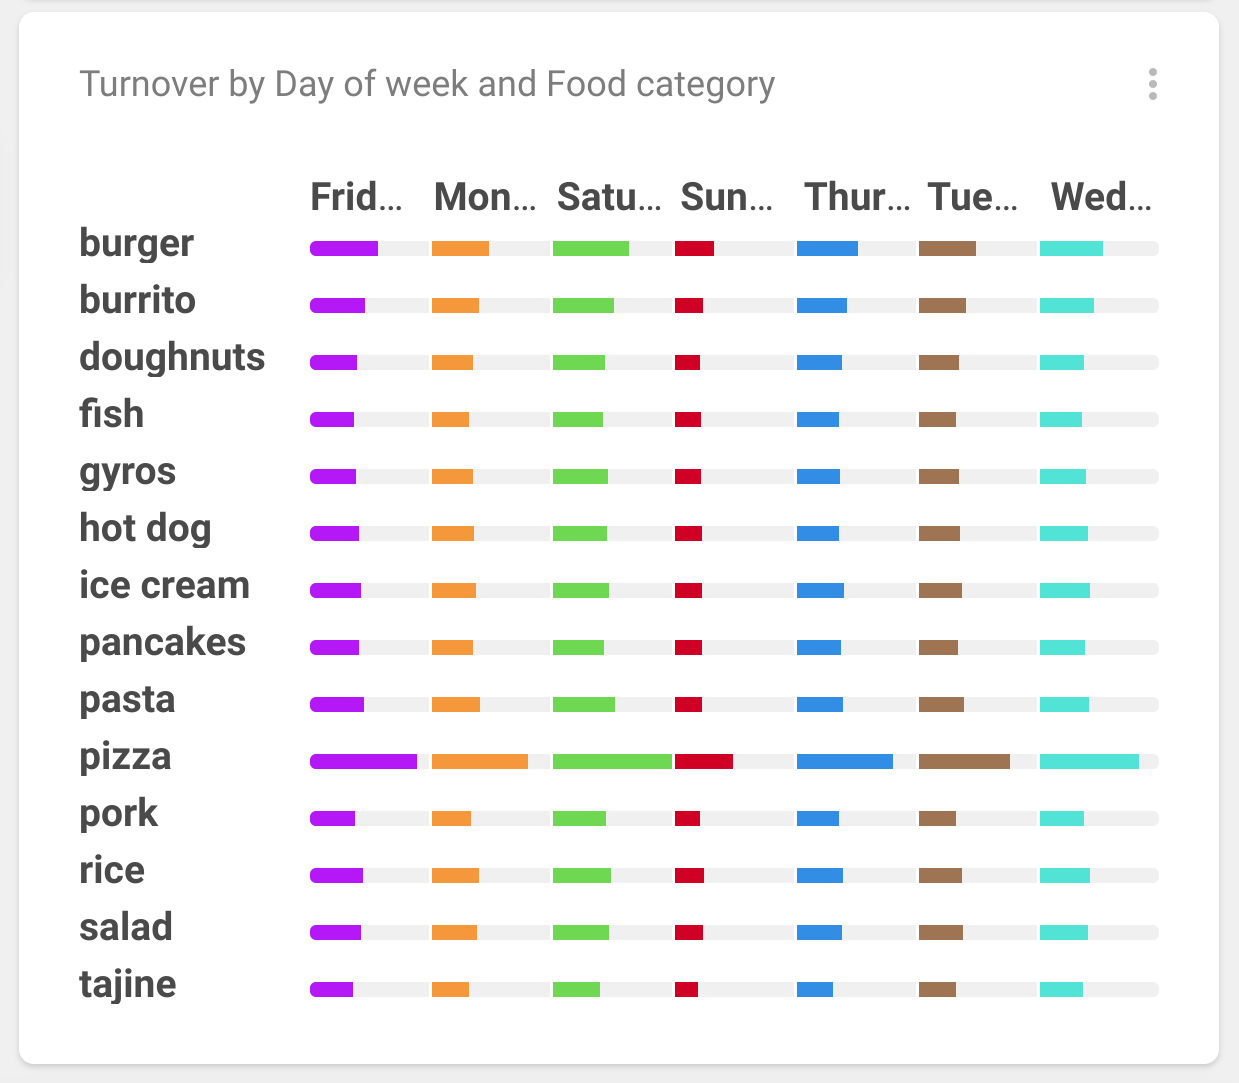
New dual categories block with more than one distinct attributes
clevermaps-js-sdk
Pass filter definition to filter listener callback as new parameter
Highly improved documentation https://www.npmjs.com/package/clevermaps-js-sdk
.png?version=1&modificationDate=1669549498354&cacheVersion=1&api=v2&width=102)
Bugfixes
Fix duplicated property ids in dwh queries which app constructed
Fix app freeze in infinite loop when adding a pinpoint to compare
Use reversed metric in categories values on drill in Arrival/Departure view
Fix collapse of distribution block
Show ranking even if loading of ranking item fitness fails
2022-10-31
New features and improvements
Allows to place Distribution, Categories, Time series and Ranking blocks directly on dashboard.
Allows to customize invitation outgoing email address per organization. We also whitelabel invitation email content to does not include CleverMaps identity.
Allows to edit disabled indicator (when indicator is not able to be visualized on selected granularity).
Improved cloned indicator, metric and drill naming to fix occuring errors (leading letter, name length, name already exists).
Adds activity panel in project detail for admins only.
clevermaps-js-sdk
Let iframe publish data about filters via the js message api. So parent page can listen on filter changes.
Let a parent apge open bookmark modal, export modal and execute fit map functionality within iframe.
Allows to creates overlay (for better scrolling experience).
Allows to add full screen button in iframe.
Allows to hide dashboard panel and map tool buttons.
Allows to change primary color and loading logo in map view. In other words it allows to whitelable map view to look&feel like part of your company brand.
Bugfixes
Fixes dashboard JSON editor which didn't accept two indicator blocs in a row inside indicator group.
Fixes dashboard JSON editor which didn't accept
datasetPropertiesandfeatureAttributes.
2022-09-30
Bugfixes
Arrivals/Departures views now works properly
InAttribute performance optimalization does not work with max_function
2022-09-02
New features and improvements
User can clone indicator on UI
After the edit dashboard feature we announced last time, we added the option to clone and edit an indicator directly from the UI. This allows you to add any number of indicators to your project without launching a command line.
Granaluarities/vizualizations are sorted like in GIS (markers, points, line, delivery zones, areas, grid, heatmap)
Filter reset button is now icon (was icon and text)
Add color (dark blue) when hovering over link on dashboard.
REST API support an optional strict mode
clients of our REST API can used a new header parameter
X-CAN-STRICT-JSON-VALIDATION=trueto enable a strict restriction of JSON payloads. The payload will be rejected if it contains any unknown JSON keys. This is useful mainly for development. The default REST API behavior is that the unknown key is ignored and not stored on backend.
Shell Release
This release of CleverMaps Shell has completed the addition of the new feature GIT versioning support for metadata. The last missing feature was a command restoreMetadata.
Read more about project versioning in the new Tutorial 11.
1.5.6
Added
restoreMetadatacommand for restoring older versions of metadata objects.Fixed Bad Request when completing multipart upload in loadCsv.
Added strict mode for validating additional properties in MD objects.
clevermaps-js-sdk
Let a client open bookmark and export modal and fit map via the sdk library.
Platform Security
We are thrilled to share that CleverMaps has accomplished its SOC 2 Type II and ISO 27001 certifications!
The SOC 2 Type II and the CleverMaps' ISO 27001 certifications only emphasize our commitment to protecting our customer's data and facilitating a safe and secure Location Intelligence ecosystem.
Learn more about our security measures in this blog post.
In addition, the CleverMaps platform successfully passed external penetration tests in August 2022 with only a few minor findings.
Bugfixes
Fix of missing geo search marker in map
GPS result circle stays on the map
Unable to authenticate to CleverMaps stories
Unable to navigate through views with share link
2022-07-11
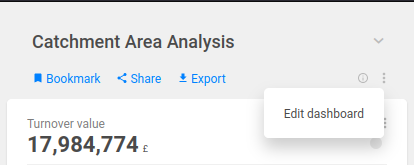
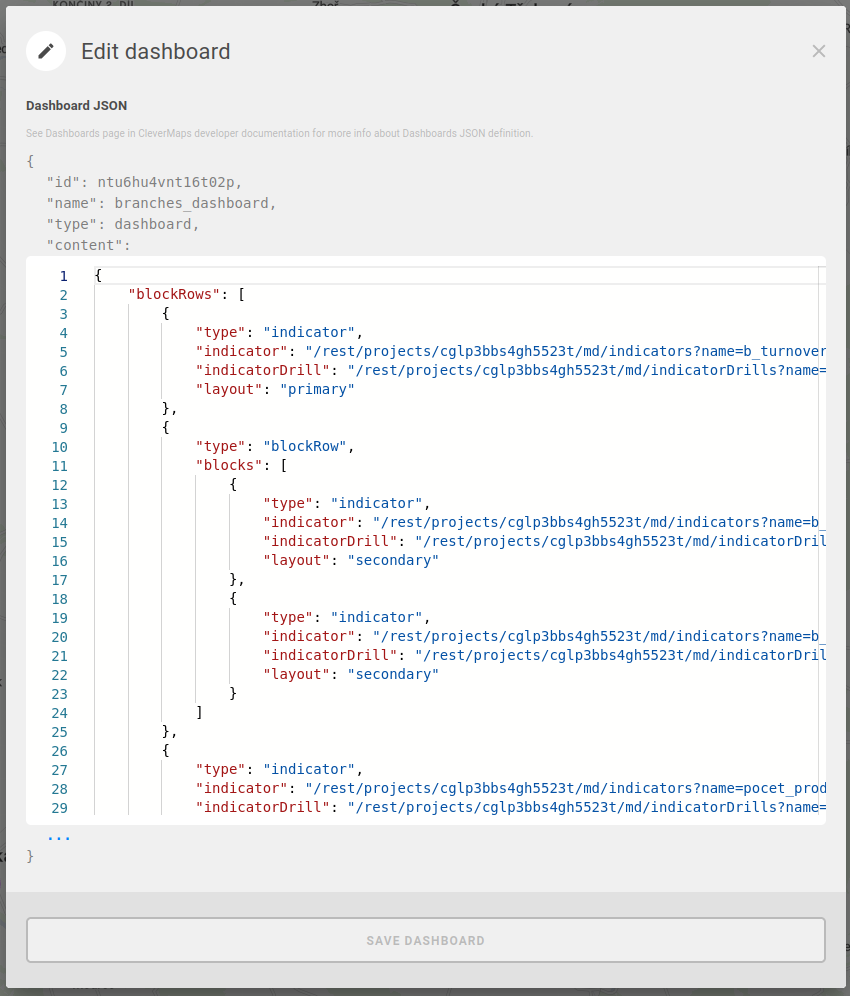
New features and improvements
Edit a dashboard from UI
We added a feature to edit the JSON dashboard definition directly from the UI.
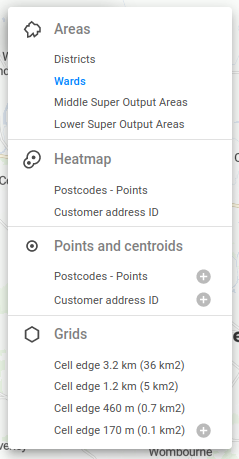
Redesigned visualization/granularity component
We have simplified the design of component for selecting visualization and granularity. User can now see all available visualizations and granularities.
Shell Release
We have released a new version 1.5.5 of CLI tool CleverMaps Shell that changed the directory structure of dumps.
We made these changes to allow the CleverMaps Shell to be used with GIT to version metadata.
1.5.5
Changed dump structure. Removed dumpIds. Now there is only one dump per project.
Changed
dumpProject --force. It now overwrites existing dump.Added
dumpProject --ignoreFailedDatasets. It skips failed datasets dumps.Share metadata objects are no longer dumped.
Removed
--directoryfromdumpProject.openProjectnow opens dump if it exists.Removed
--dumpfromopenDump.Removed
--directoryfromopenDump.dumpCsvnow doesn't create new dump.Added
dumpCsv --force. It overwrites current dataset data dump.importProject --dumpis now boolean option (previously required dumpId).importProject --dumpnow also requires--project.importDatabasenow doesn't create new dump.Removed
listDumpscommand.
Bugfixes
Fix of missing geo search for markers and search by GPS coordinates
Increased maximum number of attribute values in MultiSelect filter to 20000
Fix duplicate marker icon when selecting a marker from the map.
2022-06-13
New features and improvements
Redesigned share/bookmark functionality
We have refactored life cycle of share objects and bookmarks. Share link stores a user state of a view. In previous version, we have tried to keep share links working although the parent view object has been changed. Now the share links are valid until any change in correspondent view is made. When you or the administrator change any metadata of the corresponding view, all related share links become invalid. This will lead to simpler and more predictable behavior of share links. For more information see Help Center or Shares (Developer documentation).
If the share object is invalidated, the user is informed by a message: “The link you followed is broken, no longer valid or inaccessible due to insufficient rights.”
The share objects are now immutable so there is no need to dump them by CleverMaps Shell.
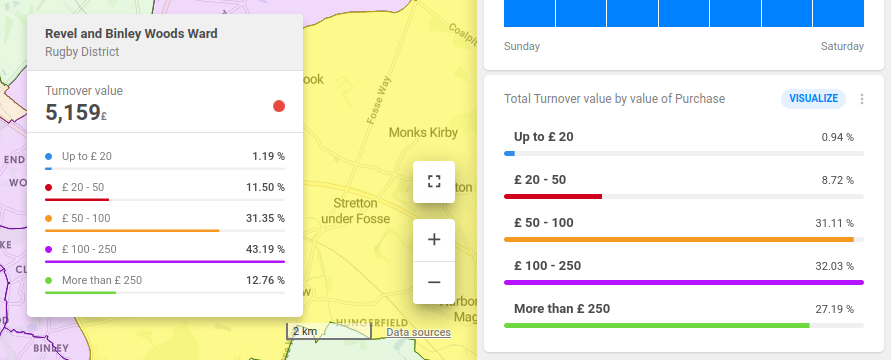
Allows to show relative values in both categories and map tooltip
Bugfixes
Some categories are missing in map tooltip when visualized and some feature is selected
Heatmap - select marker loop
Markers not enlarge on map objects selection
Organization selector is not working correctly while cloning
2022-05-19
New features and improvements
Improved filter functionality
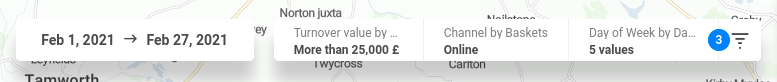
Added Active Filters section where you can see all your active filters
.png?version=1&modificationDate=1653323328062&cacheVersion=1&api=v2)
Filters are displayed and applied in the order they were added, meaning filters on a higher level apply to the ones beneath them. This rule applies to indicator filters.
The order of filters can be changed from the UI
.gif?version=1&modificationDate=1653323465543&cacheVersion=1&api=v2)
For more information about filters, visit the CleverMaps help center.
2022-03-18
New features and improvements
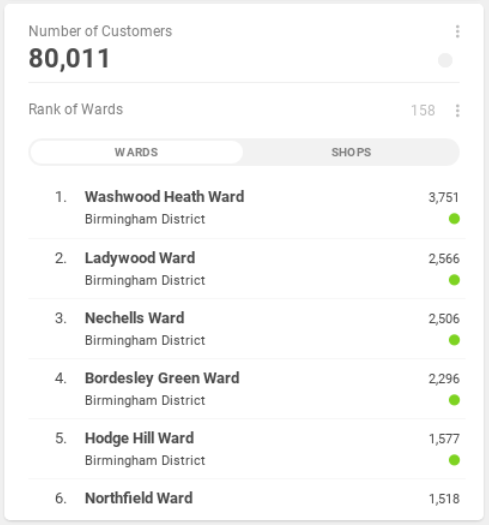
Ranking with millions of rows
Ranking block has been migrated to React, allowing to show millions of records.
New REST API for access audit log records
A new REST API endpoint
/rest/auditlogwas released to support programmatic access to CleverMaps platform audit log records. The API is designed primarily for enterprise customers and enables integration with SIEM systems.See REST API documentation for more details: https://clevermaps.docs.apiary.io/#reference/audit-log
Let nested organization button leads to the organization
Click on a organization name does not open the list of organizations but return user back to list of projects.
Bugfixes
Long text shifts button visualize over the sub-menu icons
Fixed bug of showing a dot map visualization
Fixed second step of sign-up form
2022-02-18
New features and improvements
Add organization selector in project cloning modal dialog
...
Performance optimization for computing with wide tables
If possible, cross joined attribute tables are filtered by bounding box to improve performance.
Bugfixes
Fixed selection of markers with non-computable metrics
Date filter selector is cropped because of overflow
Fix spatial query on marker
Edit categories sorting radio input is not working
Fixed error in My Projects for new user without any project
Fixed style sheets for Internet explorer page
Fixed freezing of zoom in/out buttons
Markers not enlarge on map objects selection
2021-11-29
New features and improvements
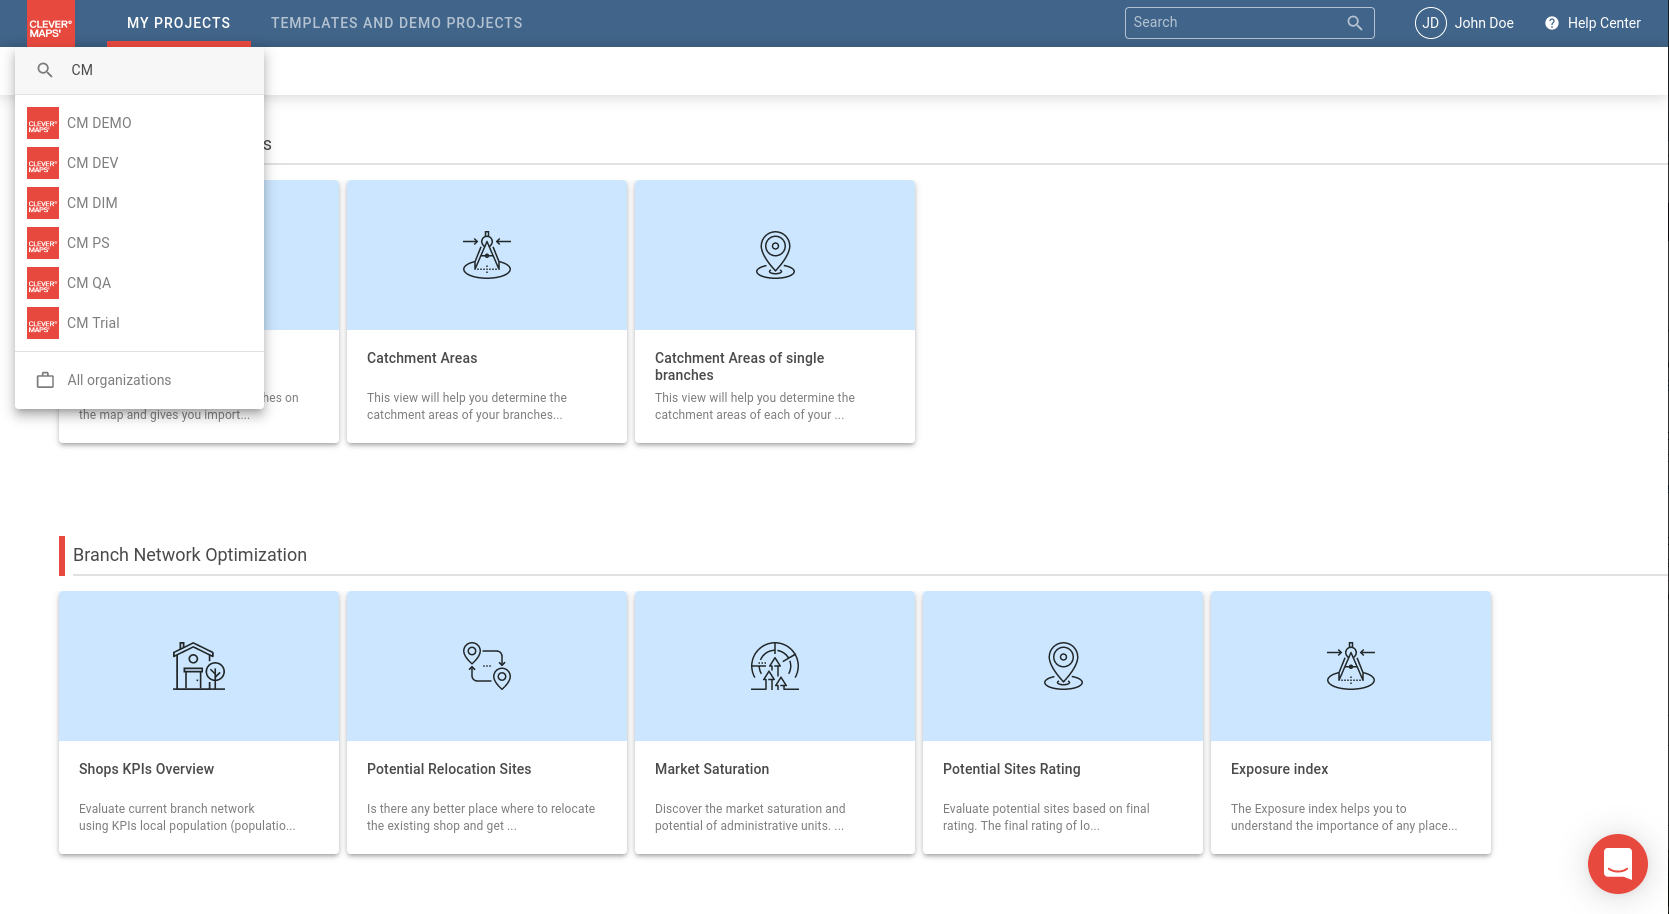
Released new organizations menu and breadcrumb navigation on project list
Performance improvements for granularities with millions of objects
The performance of the map tooltip has been improved by adding filters to calculate data only for current bounding box.
Maximal report size is now limited to 100 000 items for HASH cache type
Fixed bounding box filter calculation after granularity switch
Bugfixes
Fixed problem with downloading sample data from projects created from a template
Categories block does not react on color changes from editation
Fixed issues with no indicator value when map object selected
2021-11-01
New features and improvements
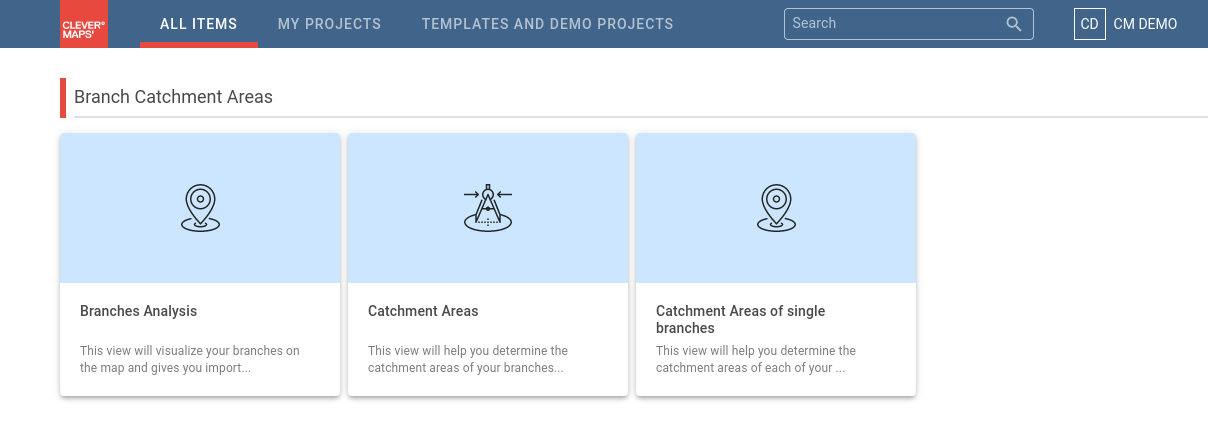
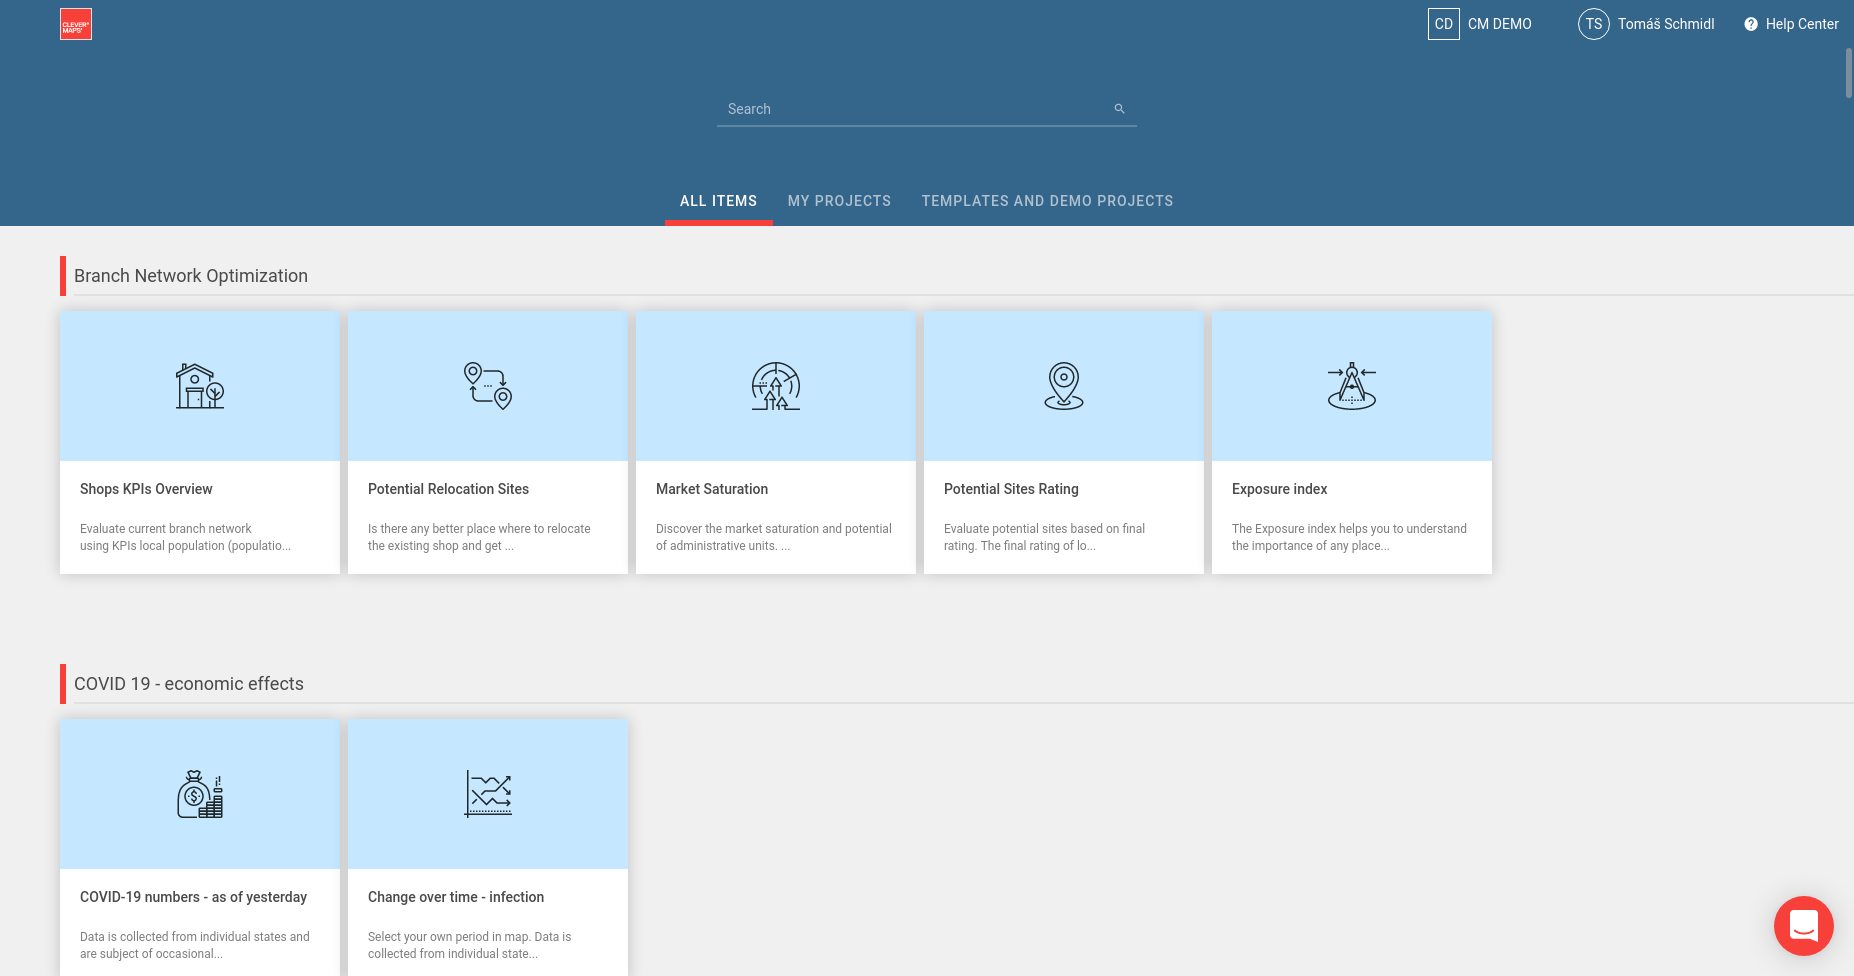
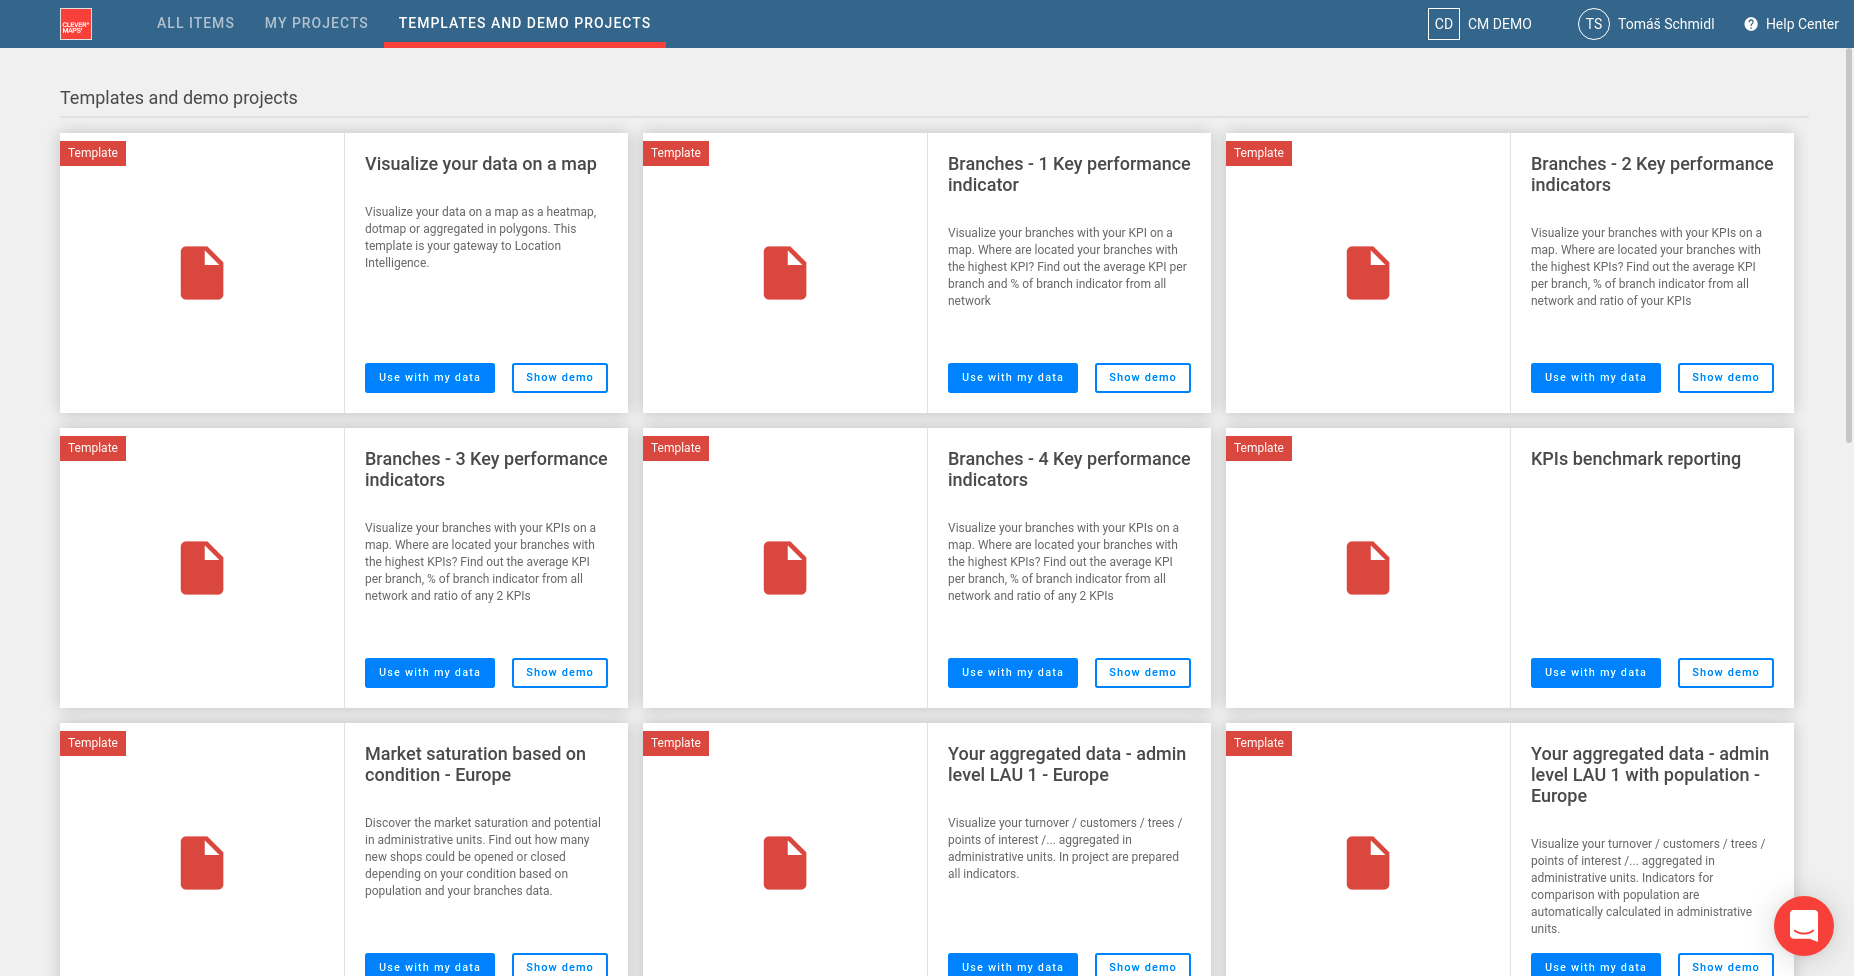
UI improvements of a Project list page
Unified a top bar for All Items, My Projects and Template and Demo Projects
Moved Search bar
Set dynamic colors in categories
Dynamic colors as set a default colors when switching off the dynamic model
Bugfixes
MetricValuesDistribution endpoint does not handle properly metric references.
Example:
offline_turnover_ratio_metricthat reuses two already defined metrics:Code Block { "name": "offline_turnover_ratio_metric", "type": "metric", "content": { "type": "function_divide", "content": [ { "type": "metric", "metric": "/rest/projects/$projectId/md/metrics?name=offline_turnover_metric" }, { "type": "metric", "metric": "/rest/projects/$projectId/md/metrics?name=turnover_metric" } ] } }
Improved DWH Query engine to process multiple nested inAttribute filters.
Shell Release
We have released a new version 1.5.2 of CLI tool CleverMaps Shell.
1.5.2
Fixed
importProject --prefixthat overrides metadata objectsAdded support for metric references
Reviewed help messages for all commands
Removed command alias
import, useimportProjectcommand insteadAdded a new command
cloneProjectfor server-side project clonning
Download the new version here.
2021-10-01
New features and improvements
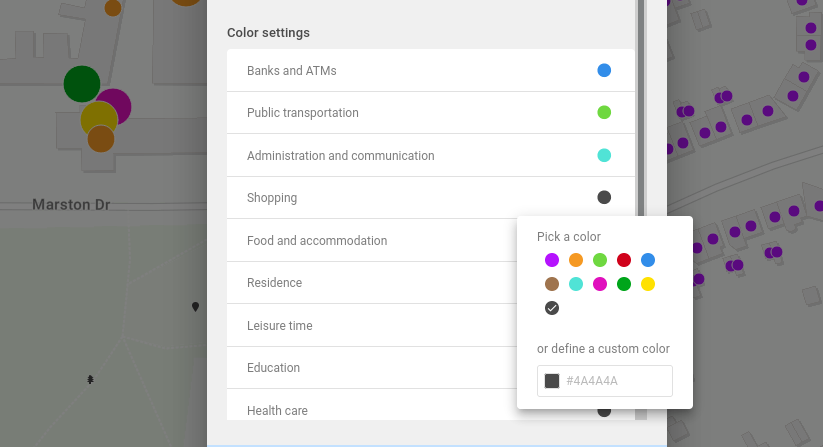
Allows to set categories colors from UI
Users can set a custom colors for each attribute values on UI
A same color can be now set to multiple attribute values

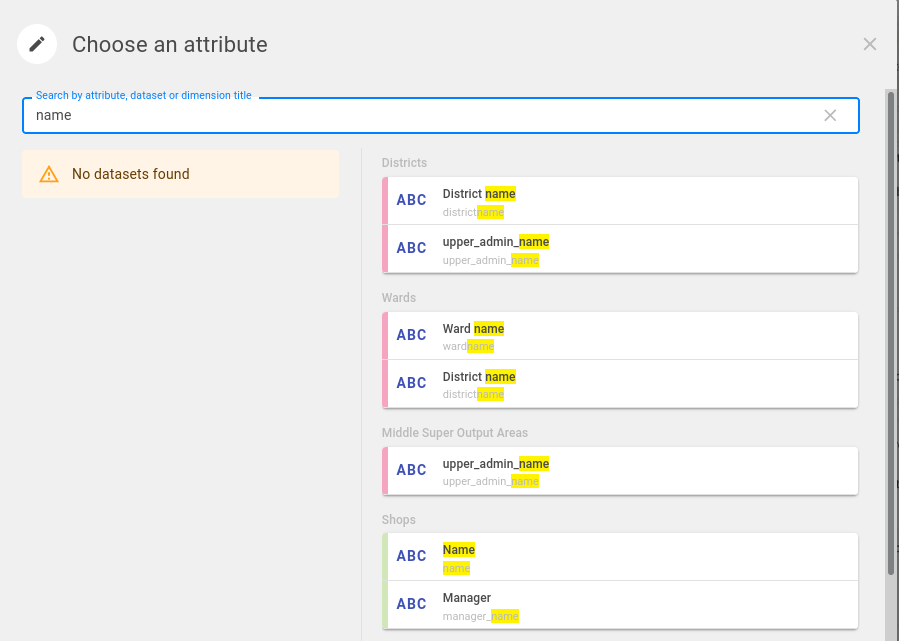
Added searching bar in modal of editing categories block
User can use full text search for find attributes in data model when editing Categories block.
Bugfixes
Fixes long project titles wrapping in left menu
Markers were not properly showed on map during the first map load
2021-09-06
New features and improvements
Faster loading of data into the map
map data is displayed immediately after loading the visualized indicator
map popup data is loaded on-the-fly when user hover on map area or marker
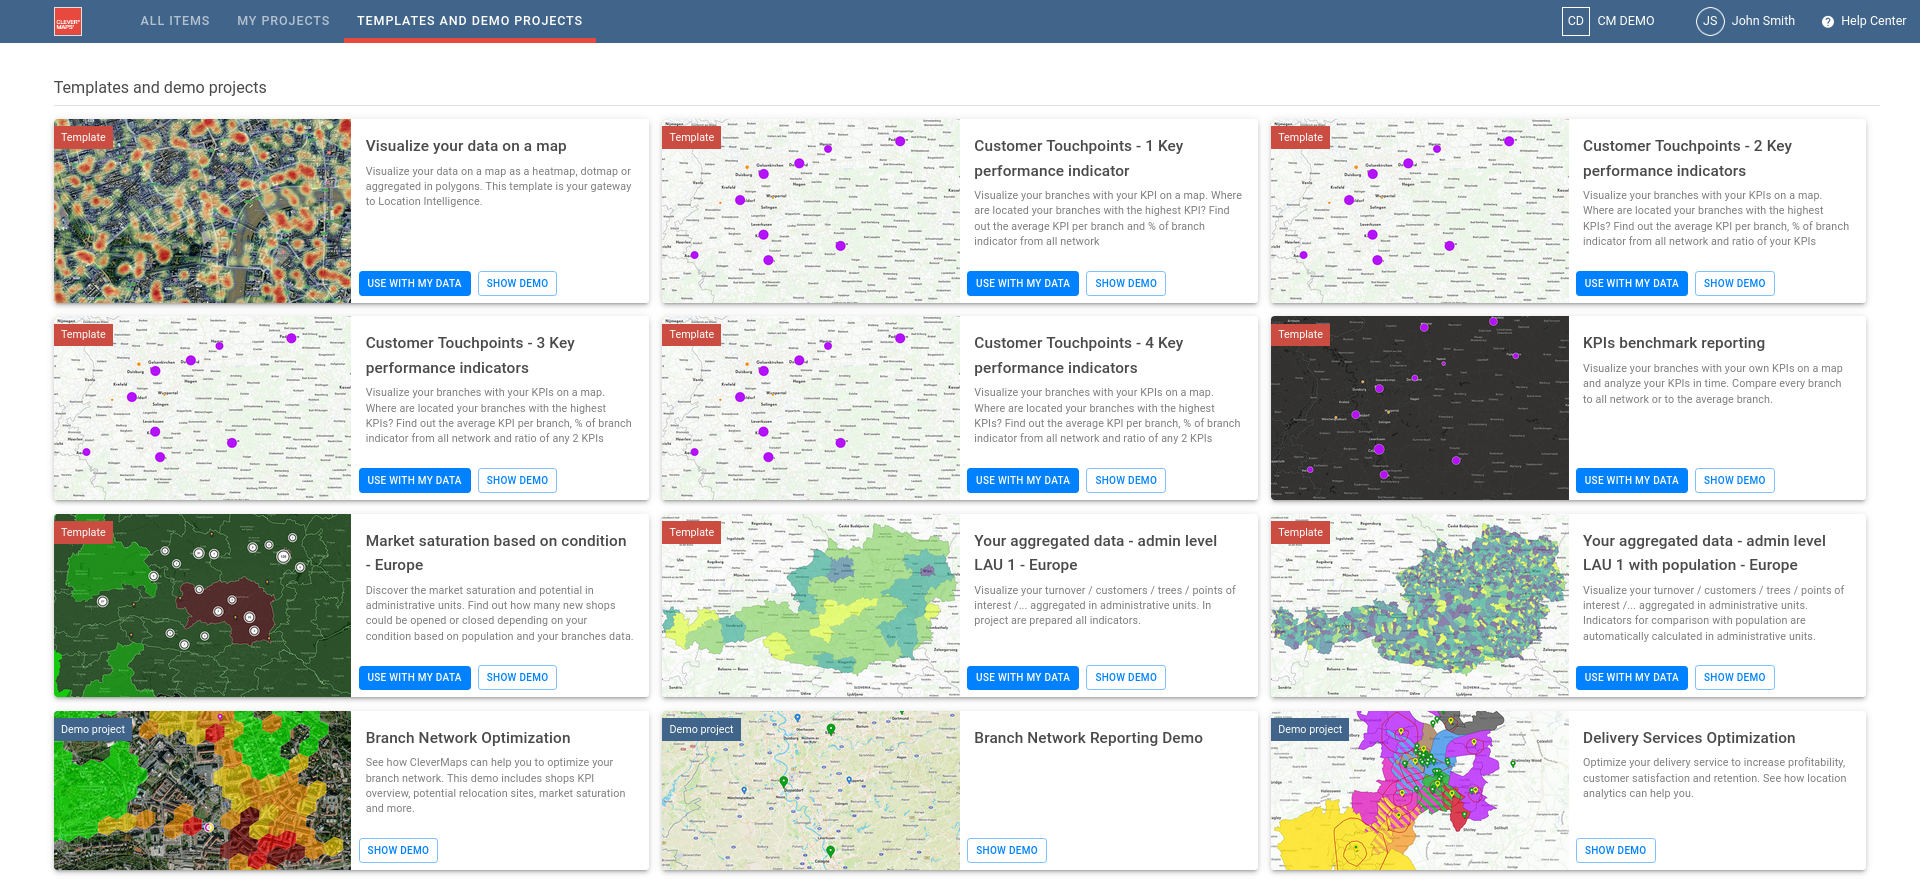
Added static thumbnail images for demo and template projects
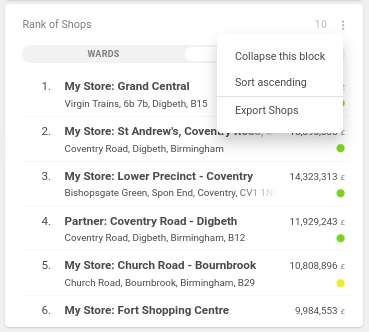
Export data from rankings block
this feature is enabled by default for all ranking blocks
export contains all properties of ranked granularity dataset
Bugfixes
rebase of shareLinks throws
Missing fieldexception in cloned projectsupdate of
projectSettings.geoSearchCountrieswas fixed to accept empty set of countries
2021-08-09
New features and improvements
...
Markdown syntax is now supported for a project description
A simple way to format text of descriptions in CleverMaps platform.
supported features: Creating formatted descriptions using Markdown
...
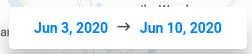
Global date filter behaviour and design has been aligned with the attribute filters
blue highlight when a custom filter value is set
reset button on hover

Bookmarks
...
All users can create their own custom bookmarks for a specific map.
Bookmark persists complete user settings including map position, selected objects, attribute and fact filters and selected tools.
...
Minor bugfixes
Dataset is not evaluated as an orphan object when it is referenced by a MarkerSelector
ImportProject with prefix overrides metadata objects
2021-06-14
New features and improvements
...
Keboola Writer supports authentication by user’s Access Token. Email/password authentication has been set as obsolete.
...
...
Advanced setting for import CSV. User can choose a seperator for CSV file and upload CSV files without a header row.
...
Settings for Categories block was extended of these options on UI:
...
User can change a dataset attribute for categories split
...
Change order of attribute values
...
Order by attribute values (alphabetical):
...
...
Or order by another attribute. This allows to order attribute values in a natural order (e.g.: days in week, age categories or stage of oportunities)
...
In both cases, user can select ascending or descending sorting and limit the maximum number of attribute values.
Edit indicator scale breakpoints. Set a custom static breakpoints for indicator per granularity:
...
Minor fixes
Fixed Overlaps in heatmap compare (eg. exposure index metric)
Unlimited XLS exports
Removes Slovak localization
2021-05-03
New features and improvements
Adds divergent indicator scale with negative segment around zero value
...
Enable address filter to search with Mapbox service.
...
Implemented login using generated access token in Shell and allow all users to generate refresh token2020-04-06
Redesign attributes block
...
Enhance map loading
...
Show inactive non default filters in toolbar counter.
Allow to use metrics in metric metadata definition
Push filters to CleverMaps IFrame
Added new DWH query function
function_percent_to_total
Minor fixes
Fixed wrong order orphan metadata removal in Shell (
removeMetadata --orphanObjects).Fixes scrolling on dashboard. It is not possible to scroll completely down because of badly set infobox height.
Fixes selecting features in filter
Registration failed
Fixed cloning of projects when executed in parallel.
Other (internal)
Remove deprecated username and password URL parameters from IFrame
2021-04-06
New features and improvements
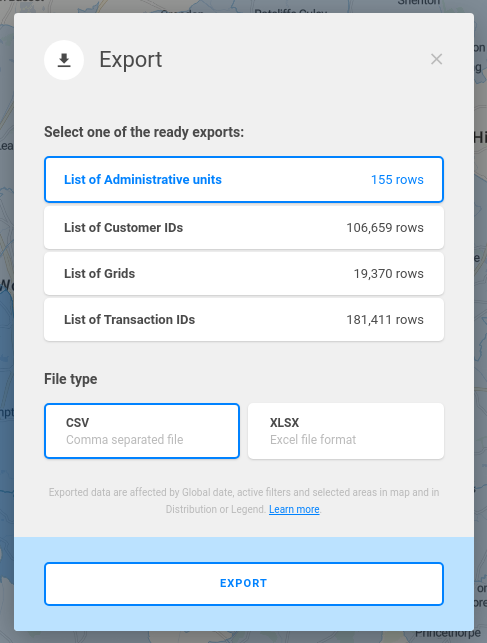
Extended Export with option to select export file format.
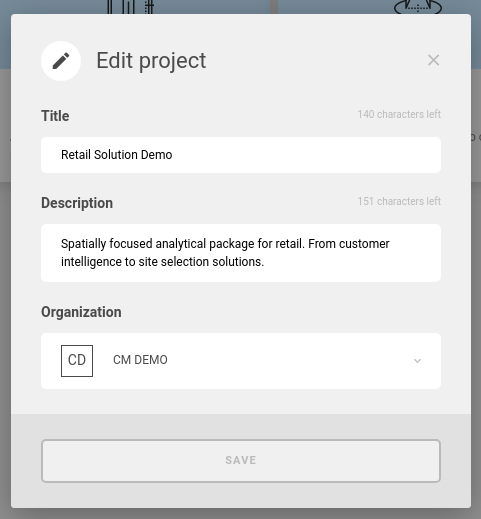
Added Edit Project functionality.
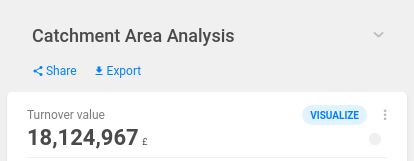
Added quick menu with Share and Export links to the info box.
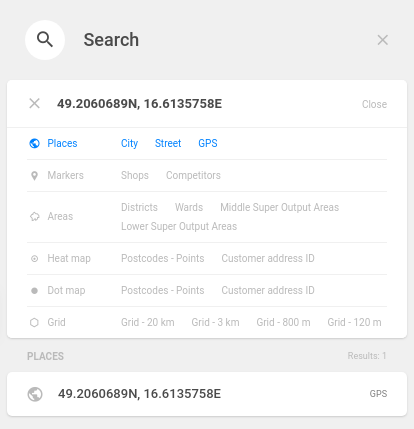
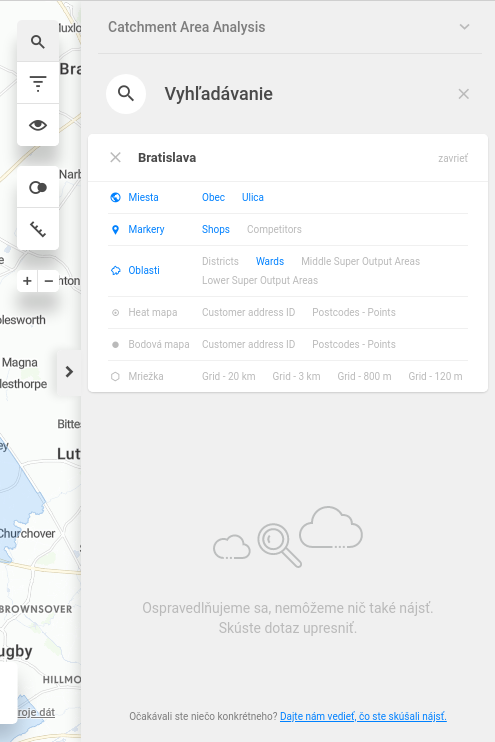
Extended Search with GPS coordinates search.
Changed marker references in marker selector from name to link.
Extended export object metadata with default output type, file format, custom filename and header format.
Implemented cascade import in Shell (
importProject --cascadeFrom).Implemented orphan metadata removal in Shell (
removeMetadata --orphanObjects).Added ability to load data from any HTTPS URL to Shell (
loadCsv --url).
Minor fixes
Fixed problem with returning partial query results (e.g. H3 grid queries with lot of results).
Fixed Data Preview and CleverMaps Stories on Safari browsers.
Project List adjustments:
Clickable project title.
Template buttons aligned to right.
Display project skeletons instead of throwing error when opening organization with no projects.
Shows disabled projects on project list.
Slow scrolling on touchpad.
User always lands on project list after logging in.
Fixed DWH
validatecommand comparing 'character' and 'char' SQL types as not equal.Improved geosearch in Germany, fixed highlighting and some other bugs.
Fixed project title not showing when Clone project fails.
Fixed “current transaction is aborted” error when using
dumpProject --force.Fixed indicator filters in Branch Network Reporting Demo.
Fixed ranking block on dashboard ignoring
dontAgregateBy.
2021-03-02
New features and improvements
Added new Project list.
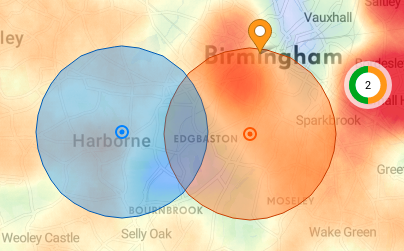
Enabled Compare functionality on heatmap visualization. Redesigned dominance and overlap flow in Compare.
Added new Filter toolbar for better user experience.
Implemented support for H3 grid with materialized columns. This use case fits when the performance of regular H3 grid is not sufficient (for more info, contact us at info@clevermaps.io).
Added
--s3Uriparameter toloadCsvcommand, which allows you to upload CSV files directly from AWS S3 to CleverMaps.Implemented more robust share links.
Intelligent JSON array rebase (it’s now possible to move view filters or indicator drill blocks up/down in the array without breaking existing shares).
Share objects no longer store the changes in JSON objects. It’s easier to rebase them when the change applies to one string, integer, number, or boolean value. (see documentation).
Removed rendundant share object properties (
“/etag“,“/content/blocks/0/id“).
Minor fixes
Export function is no longer adding indicators from indicator filters to the exported file.
Fixed Compare ignoring dominance with
defaultVisualizedindicator.Removed limit of loading maximum 20 000 H3 grid polygons.
Fixed unsupported browser screen visible on the app loading page when on slow internet connection.
In case of
geometryPointdatasets, the latitude and longitude properties had to be named “lat“ and “lng“. This is no longer required, you’re free to name them however you want.Fixed vertical
categoriesblock not being editable from UI.Null categories are displayed using the same color in categories block, map legend and map.
2021-02-01
New features and improvements
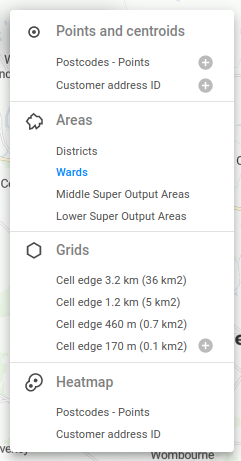
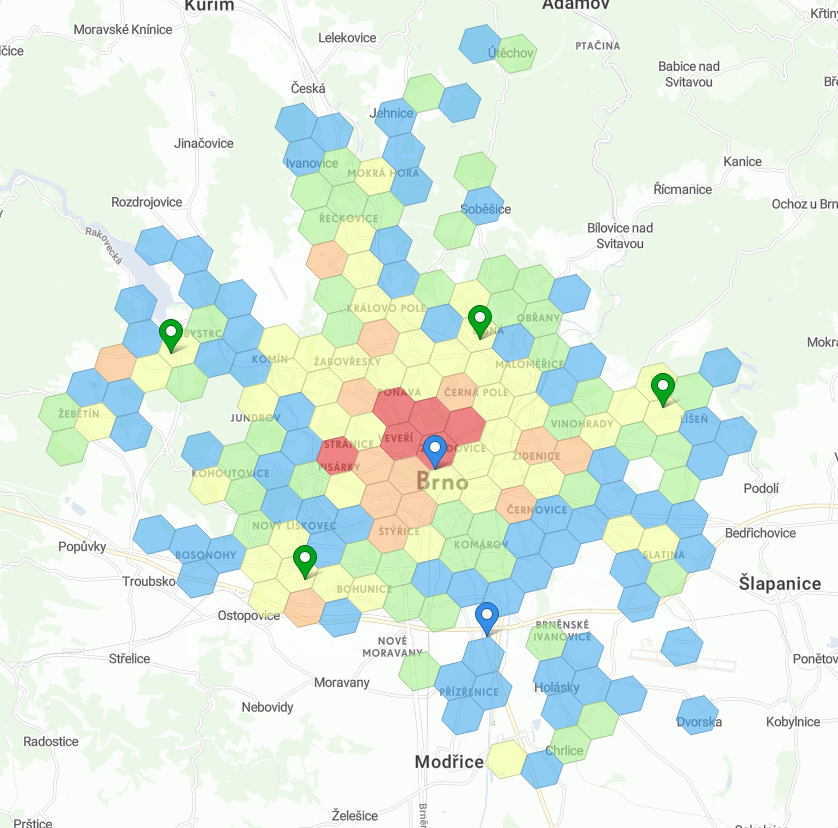
Implemented native support of Uber H3 grid visualization (see documentation).
Exports are now defined per view - it’s required to configure which exports will be visible in which view. Current projects' metadata were migrated (see documentation).
Added Organization column to
listProjectscommand output, added--organizationparameter.Added ability to dump and push Share objects which represent the state of the application persisted when using the Share function (see documentation). Available since Shell 1.4.5-RELEASE.
Improved performance of data preview in data model. Number of rows in the DWH query is limited to 1000.
Longitude and latitude columns of
geometryPointdatasets must not be null.
Minor fixes
Fixed data upload task which failed with illegale state error.
Fixed highlight sticking when selecting and hovering areas/grid/lines.
deleteProjecttask does not fail when DWH/MD database does not exist.listProjectsdoes not show organizations of deleted projects.
2020-12-07
New features and improvements
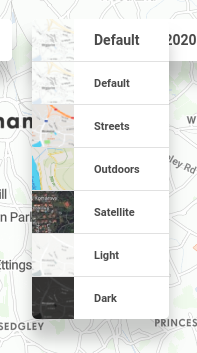
Added selector icon for switching base map layers. Details in developer documentation.
Show empty string values in both select filters and categories.
Improved performance of map and ranking block with many areas or lines.
Show tooltip on compare header hover.
Adds support to choose any hex color for qualitative visualization in metadata. See
valueOptions.hexColorin Datasets documentation.
Implemented
query.orderBy.nullsfor specifing sort of null values (=“last”, “first”). Details in developer documentation.Initial support of organizations. Each project can belong to an organization which is uniquely identified by its ID. Extended Shell
createProjectandeditProjectcommands to assign projects to organizations.Extended
/sharesAPI - it's possible to dump, push and delete Share objects like any other metadata object.Added new
applyDiffcommand, which allows you to create a metadata diff between to live projects, and apply this diff to a Shell dump. Details in developer documentation.
Minor fixes
Fixes in in share links:
Spatial query
Collapsed/expanded state of indicator groups and blocks
Improved character limit counter behaviour in Edit indicator.
Fixed bug when indicators in groups does not show second value in Compare.
Fixed project page background on disabled projects.
Fixed bug in tooltip for multiple records at the same location.
Fixed issue with sending an email invitation to email address containing character '+'.
2020-11-09
New features and improvements
...
Finalization of in-memory caching - all queries in the app are now cached. The old synchronous endpoint was disabled.
Extended Edit indicator dialogue with visualization and scale settings.
Support of multiple dots at the same location. This can occur when two or more dots have the same latitude and longitude when using the dotmap visualization. After hovering the dot, all records are displayed and it’s possible to drill on each one of them.
Links in featureAttributes are now being shortened to the hostname.
It’s possible to open the app in a new tab using Ctrl (Cmd) + left click on the Project page button.
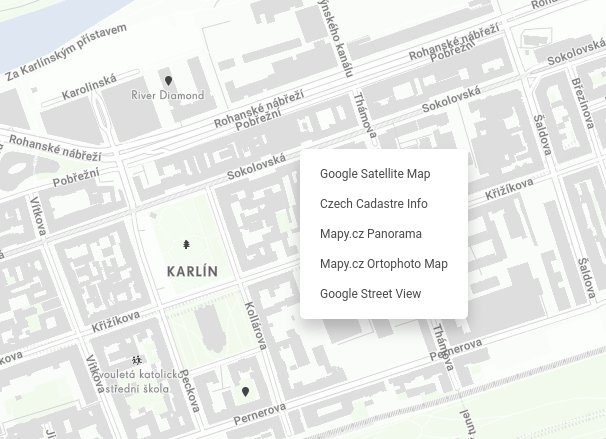
Google Maps and Google Streetview are the default options when using Ctrl (Cmd) + right click in the map.
...
Increase character limits while editing indicators, blocks and views on UI. Each Title can be long up to 150 characters, and Description to 1500.
...
Use modern browser message is displayed to users which open the app in unsupported browsers.
Minor fixes
Fixed failing geosearch queries which contained slash (e.g. address “Brno Lidická 1869/28”).
Fixed ordering of
verticalcategories. Null values are not specified as the last value, which is consistent with regular categories.Disabled automatic translation of the app page in Chrome browser.
Error messages of failed queries are now propagated to the client - ie. to the broswer developer console.
Fixed error when creating a share link, while someone already updated some of the view’s metadata in the meanwhile.
Fixed bug with editing an indicator which is used in multiple views using Edit indicator.
Improved Clone project feature on UI which failed on expired authentication token (The token is always renewed when cloning or deleting a project).
Improved dotmap performance when rendering a lot of dots and hovering over them.
2020-10-12
New features and improvements
...
Allowed to use one metric property in inAttribute filter. The value of this metric (typically min or max) will be joined with the parent main dwh query. This allows filtering last dates for KPI use-case. See the examples starting with filter_by_metric in Metrics cheatsheet.
Added ability to set a precise value in isoline and metric variables.
The active indicator value is shown on the map for each polygon. This option can be turned on/off in the Visibility tool, and showIndicatorValuesOnMap in marker selector metadata.
Enabled editing indicator title, description and format values. Please note that this feature is only available to project editors and administrators.
Minor fixes
Fixed serialization of dates as timestamps (e.g. 1602483514) for in-memory caching queries.
Fixed
globalDatefilter overflow - when there were too many years available.Fixed bug when cached dwh queries still remained in the project after
truncateProject. As a result, incorrect query results were shown even after full data upload.Fixed bug when selecting some categories and the metrics were not computed correctly.
Do not append zero values to the end of chart in vertical categories.
Fixed failing metrics with variables in Compare.
Fixed format of line Measure - too many digits after decimal point were shown.
Improved meta tag content. When sharing a link to CleverMaps, and link preview was generated, “can“ title was shown. Now, the title says “CleverMaps”.
Fixed broken layout of vertical categories with negative values.
2020-09-14
New features and improvements
New visuals of blocks on Dashboard
...
The “disabled” filter functionality was removed. Users can “select all” values with standard UI tools to disable data filtering.
...
Now it’s possible to edit Block title and description on UI if the Block has some of these properties.
...
It is possible to disable full-text search on the dataset - useful for datasets with generated IDs, like grids. Can be disabled using the fullTextSearch property in Datasets.
...
Map in view is centred according to data if mapOptions doesn't specify the exact centre and zoom.
This is useful for Templates, where users can upload their own data from any location and immediately see their views centred appropriately.
Default Czech settings were removed.
Minor fixes
The data preview button is easier to find.
...
Switch to heatmap visualization forces to turn off qualitative categories visualization.
User does not have to turn off qualitative categories visualization to go to the heatmap.
...
Cloning projects on UI was improved:
It should now handle big sized projects.
When the cloning fails, a proper error message is displayed.
...
The spatial query can be configured to set more precise distances.
2020-08-17
New features and improvements
View title and description can be edited on Project page UI. It is available for Administrators and Editors of the current project.
Indicator with Block can be used inside Indicator group. Standard on dashboard metadata property is used to turn on this feature.
Spatial query headers display all selected coordinates if more than one coordinate is selected.
...
Data in the map are loaded only for active Indicators and Indicator groups. Indicators from collapsed Indicator groups are ignored.
Breaking change: Visibility of objects in the map now depends on active Indicators, previously all Indicators from Dashboard were taken into account.
This can significantly improve the performance of map layers if there is a lot of Indicator groups on Dashboard.
Minor fixes and improvements
Collapsed state of blocks is saved for Sharing.
“Eye icons” in the Visibility panel were replaced with the Show/Hide tool.
...
Improved positioning of large map tooltips. The whole view height is used to display tall tooltips.
2020-07-20
New features and improvements
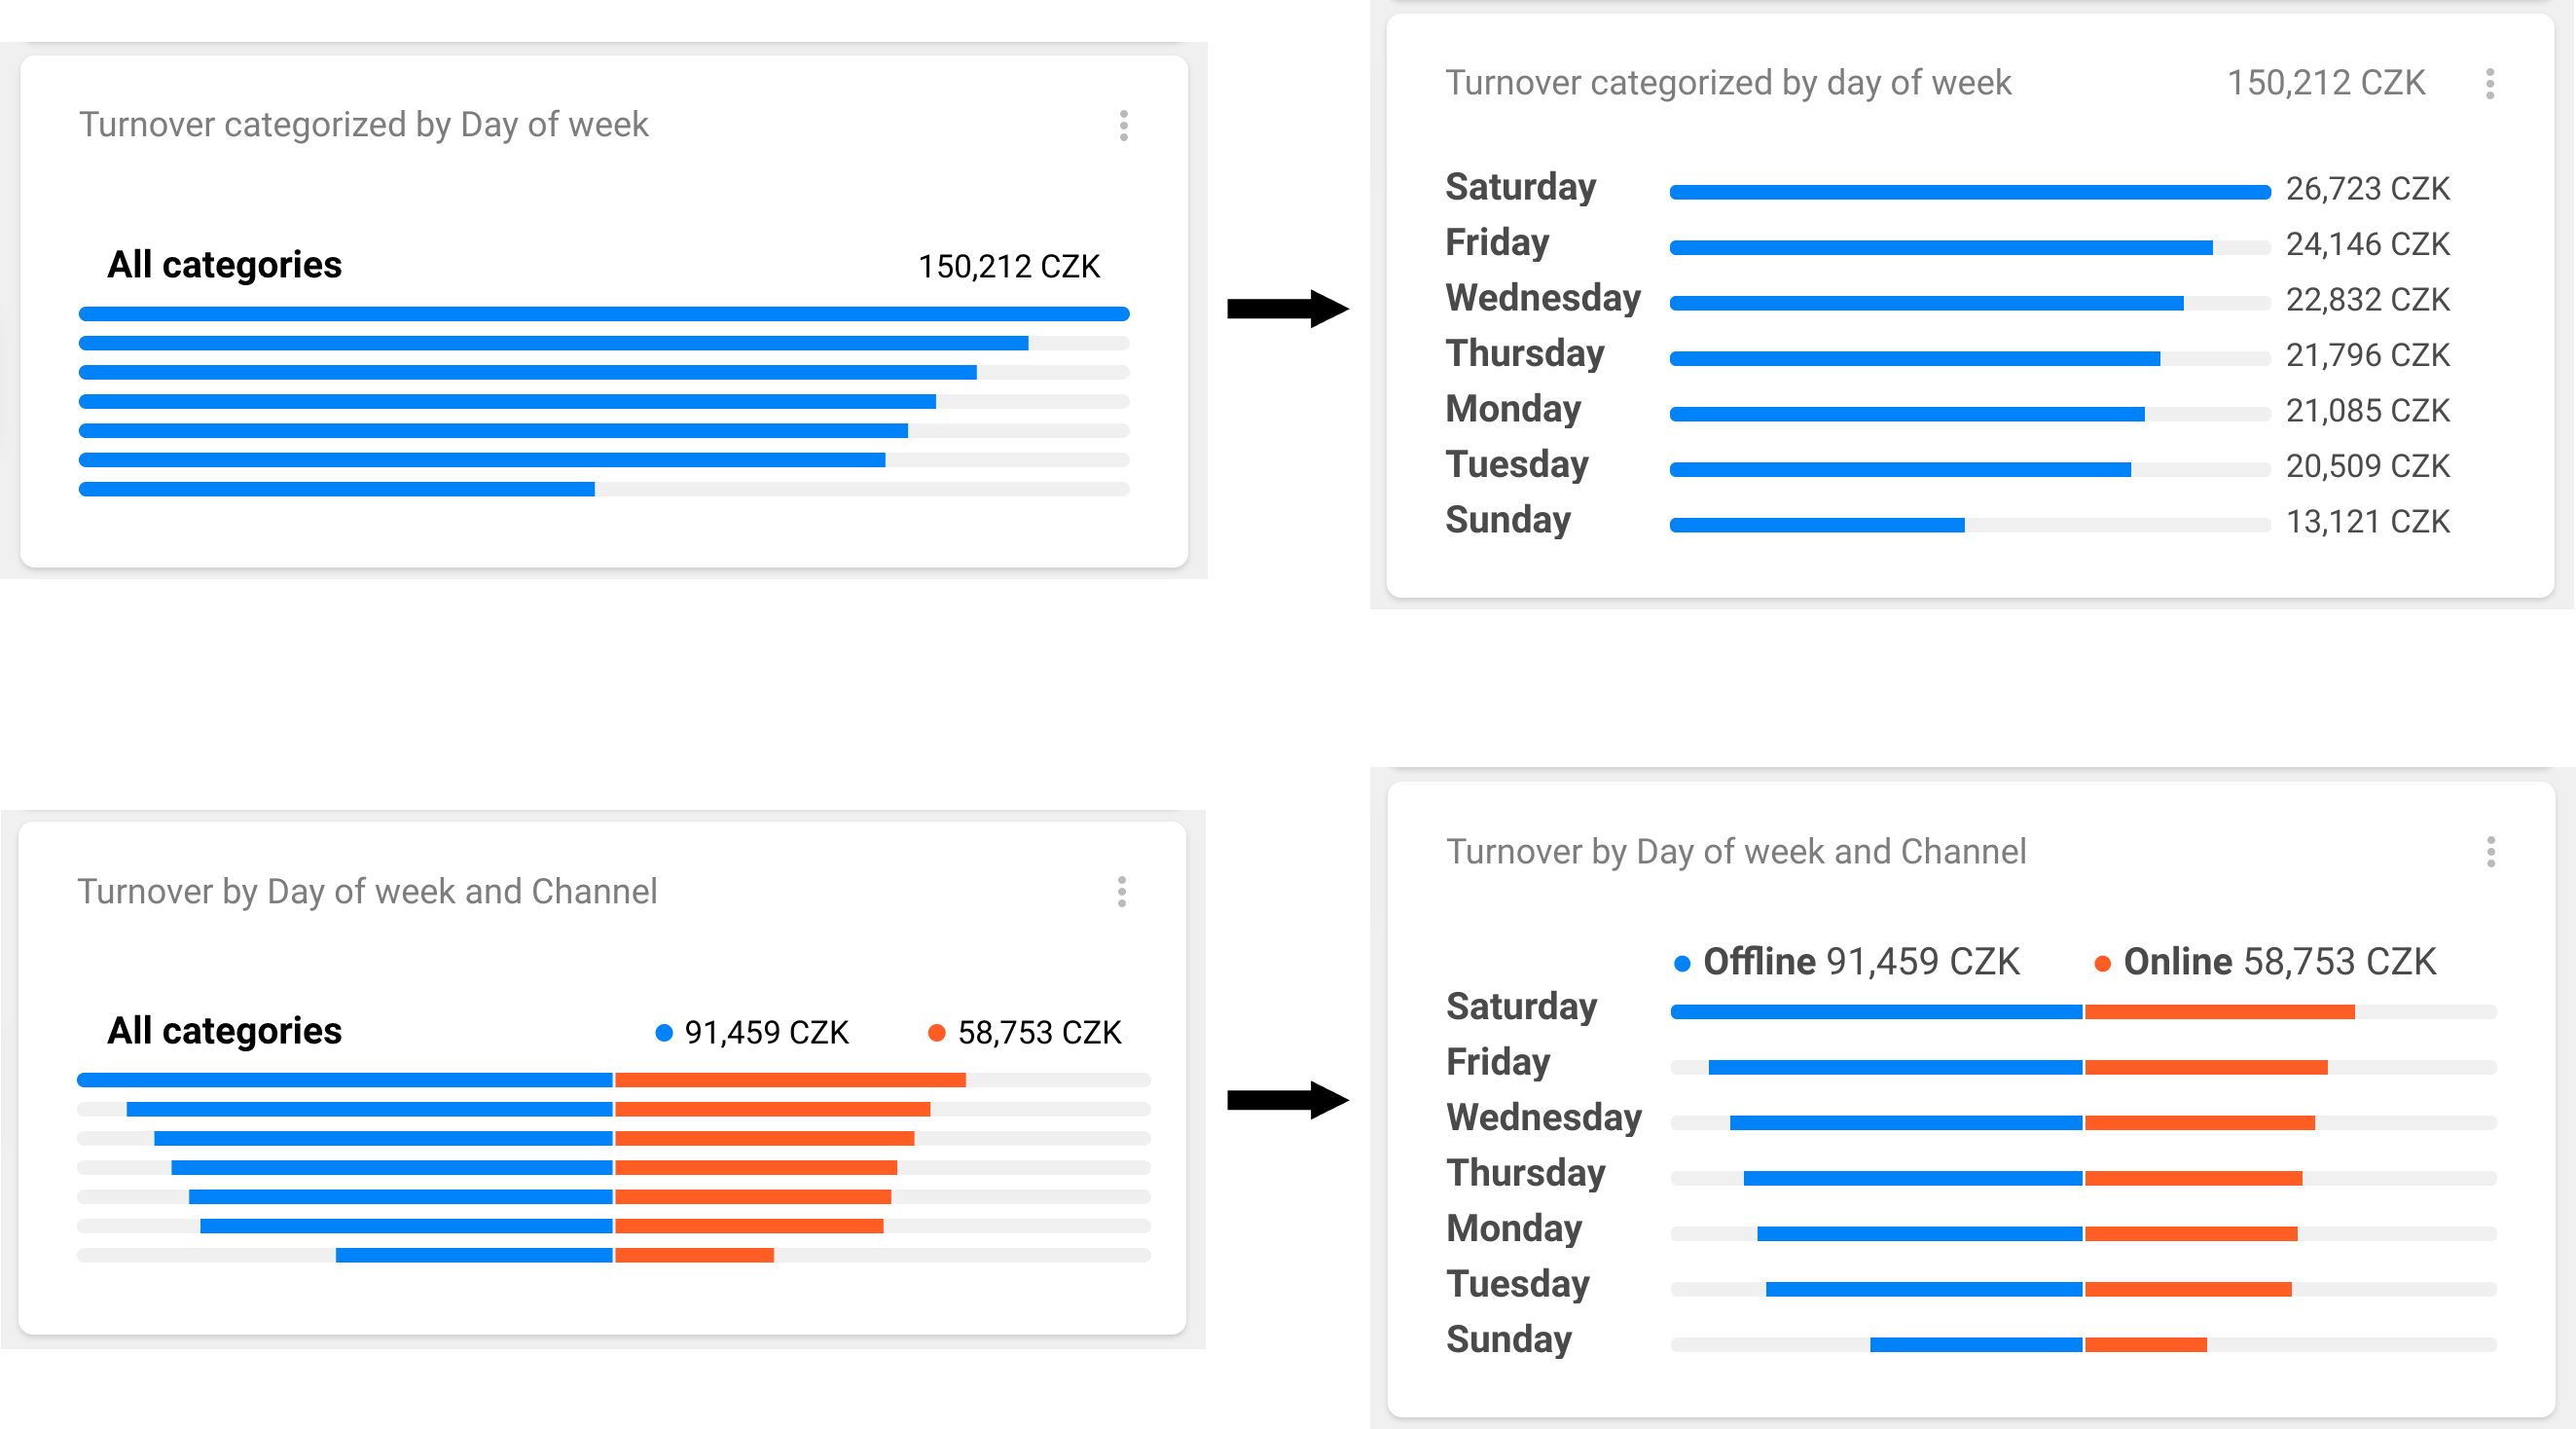
Created new variation of Categories block called Column chart. Can be turned on by
verticalproperty (See Indicator drills ).These are useful for visualization of some trend-like data (days of week, months of year...).
Improved internal processing of metrics with attributes
Better performance of these metrics
Fixed duplicated rows with null values in Export
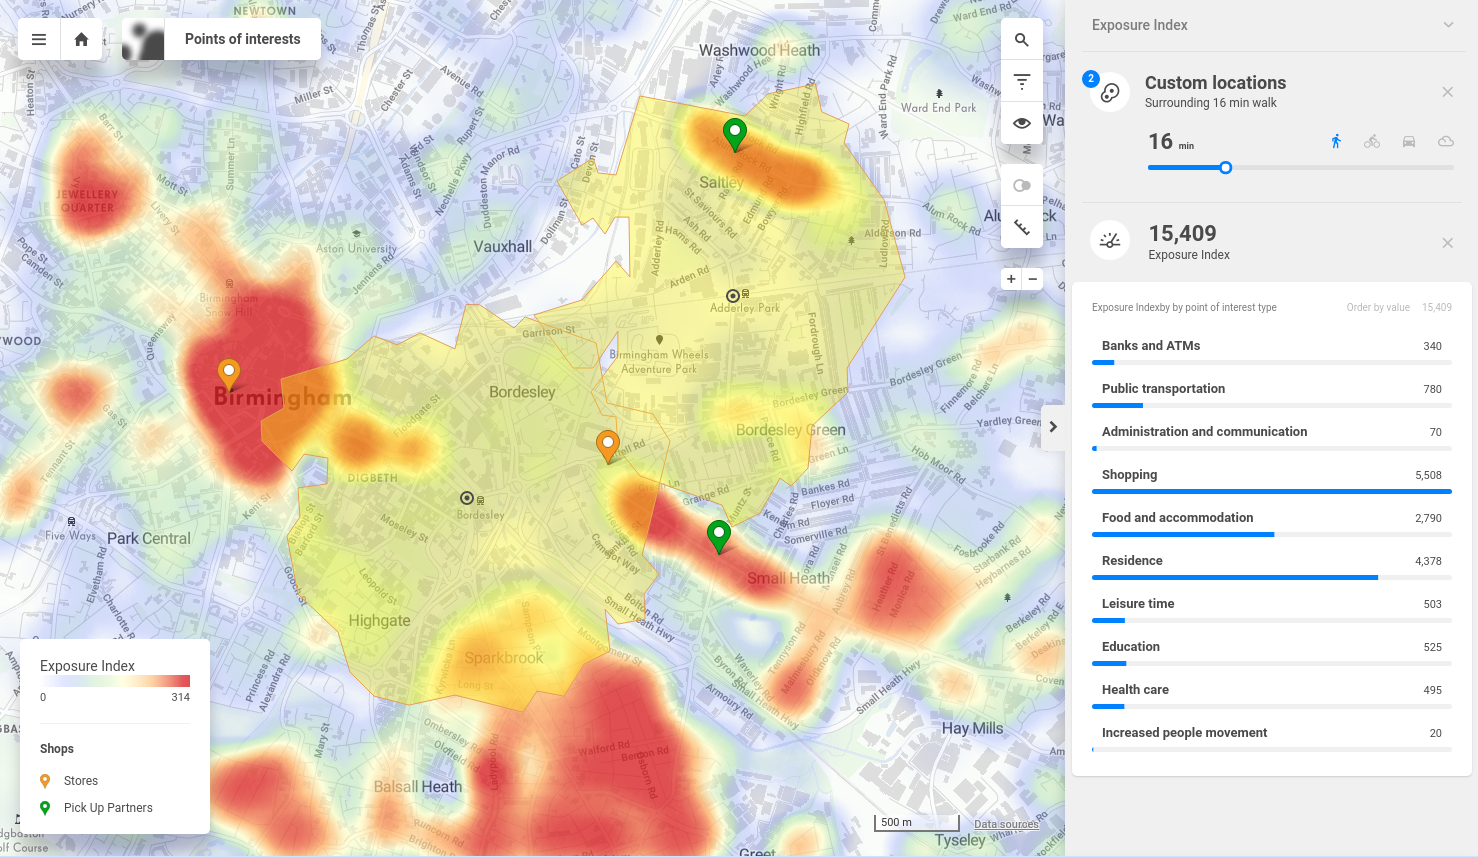
Users can select multiple custom locations in the heatmap and combine spatial queries.
Spatial query configuration in header is always visible when it's available.
Read more about it in Help Center.
Enabled sorting of categories on UI.
Users can switch order of Categories by value or by some default (ie. alphabetically).
Minor fixes and improvements
Fixed
hideNullItemsin Categories when the indicator was formatted as percentage.Better error message when user doesn’t have sufficient access rights in Shell. (E.g.: dumping data from demo).
Optimized reloading of granularity layer.
Layer is not repainted/reloaded when some feature from the same layer is selected.
2020-06-23
New features and improvements
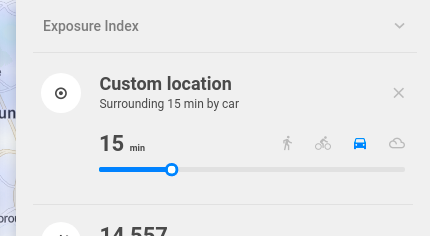
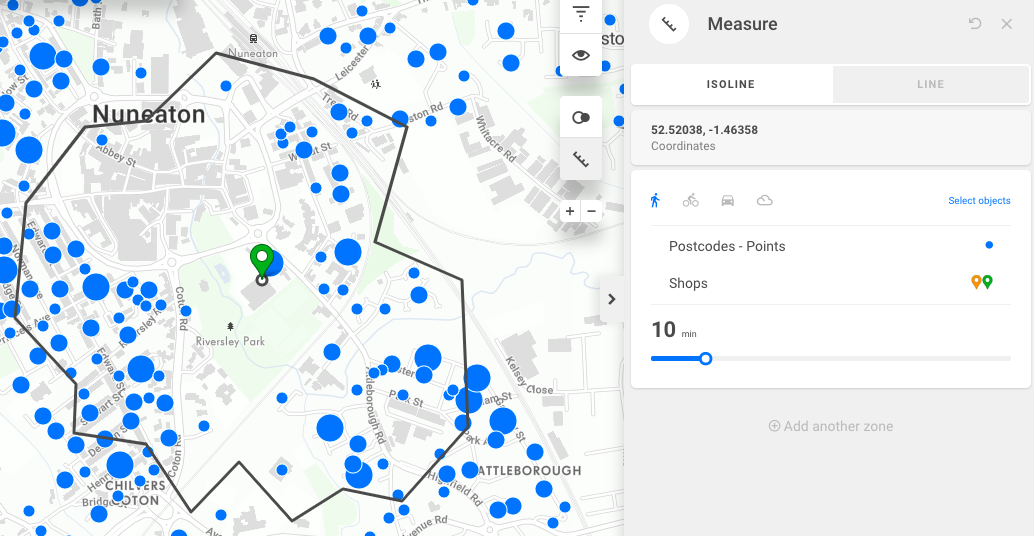
Spatial query
User can set distance and different types of coordinate spatial query (air, walk, bike, car) in the heatmap.
Detailed description is in the article How to understand Heatmap in our Help center
Default radius (distance) and type can be set up in Views metadata, see
spatialQueryconfiguration.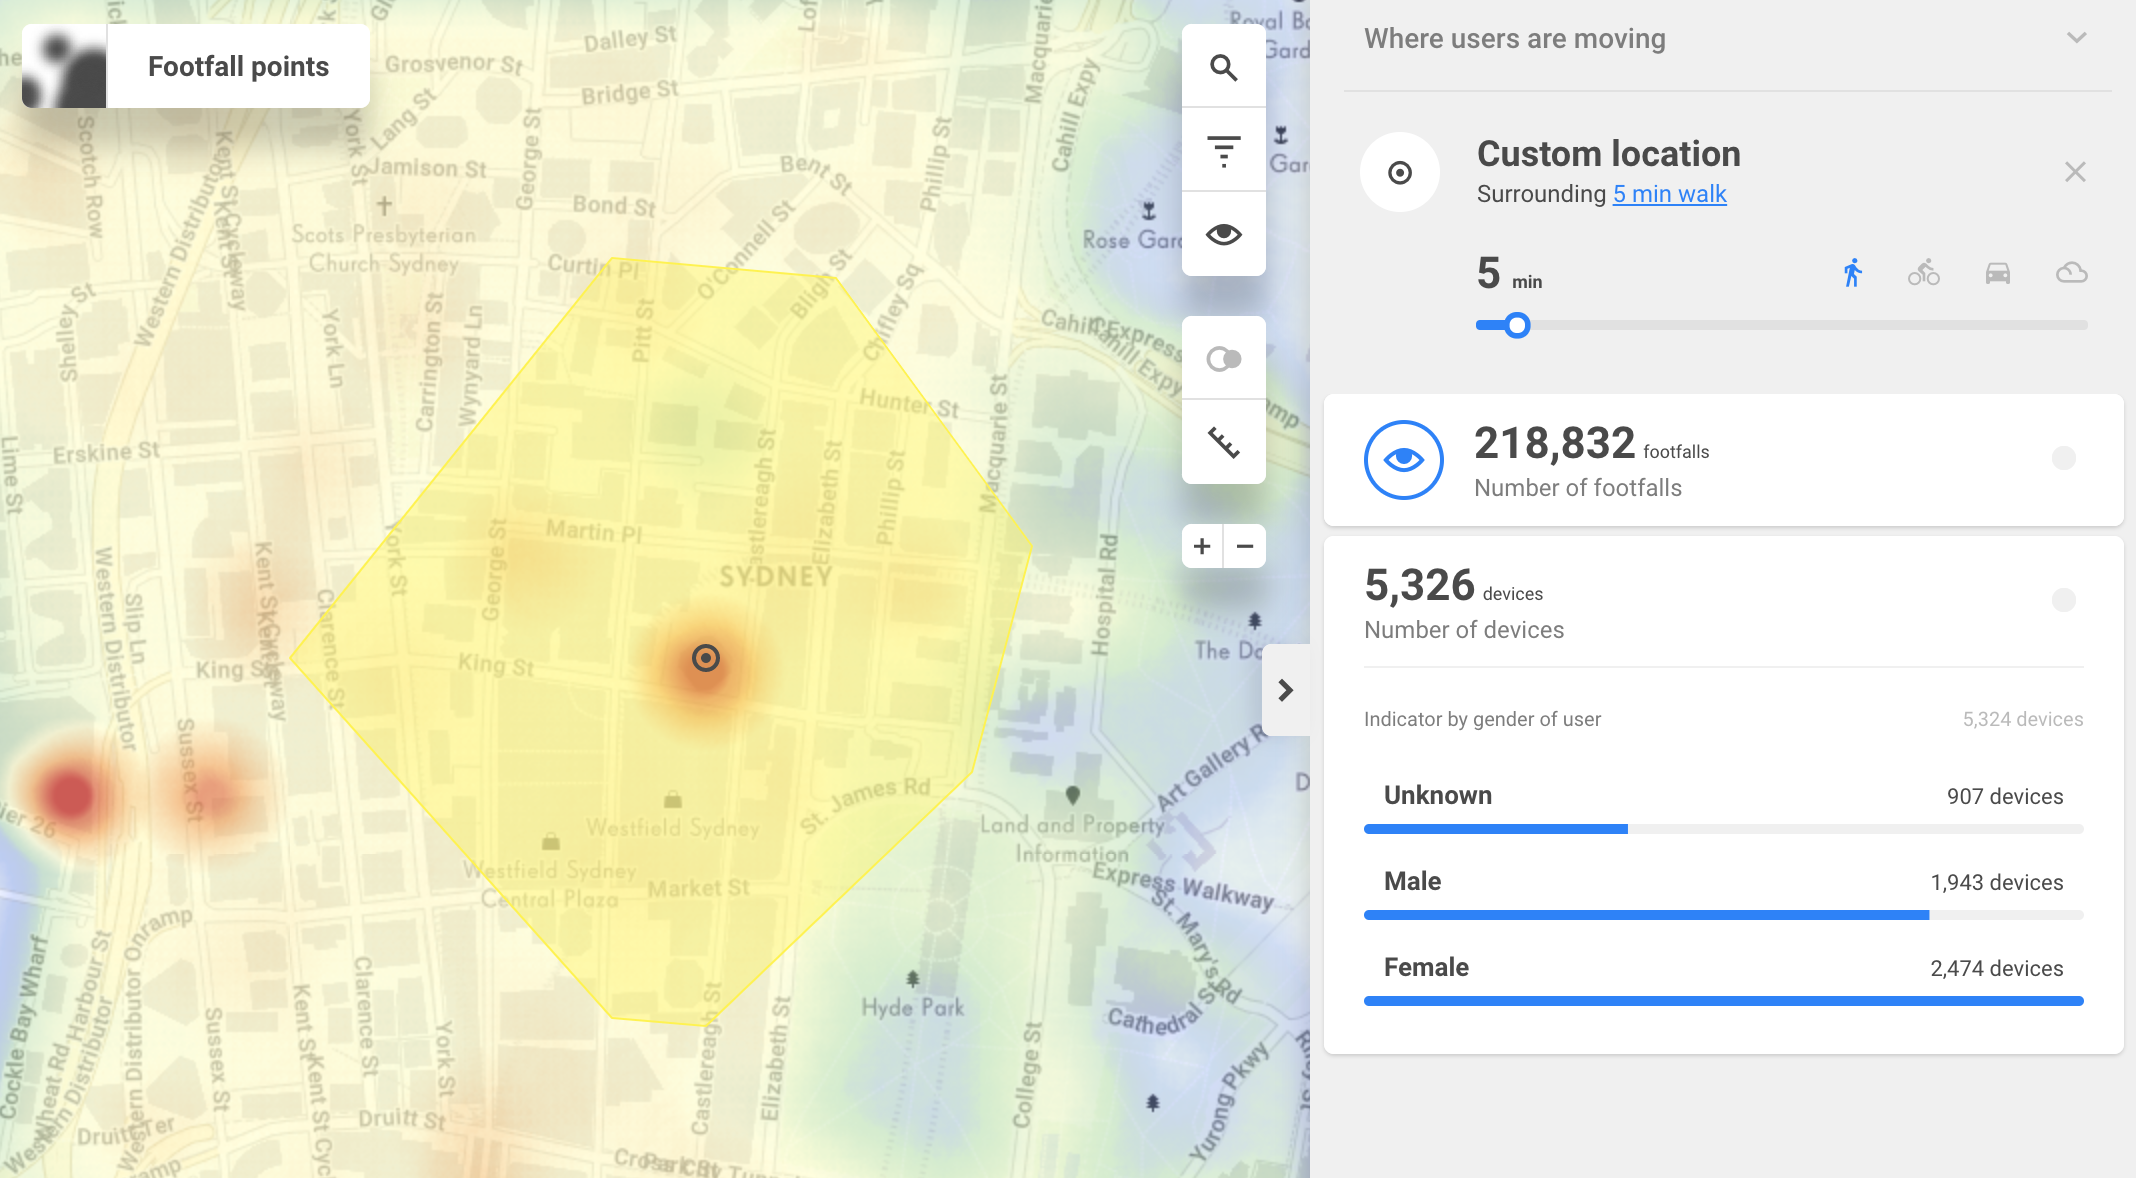
Attributes
Attributes can be available on Indicator drills
set up in Views metadata
select object with indicator allows you then to see all attributes in the bottom of dashboard (it is not possible to set up the order of indicators, blocks and attributes
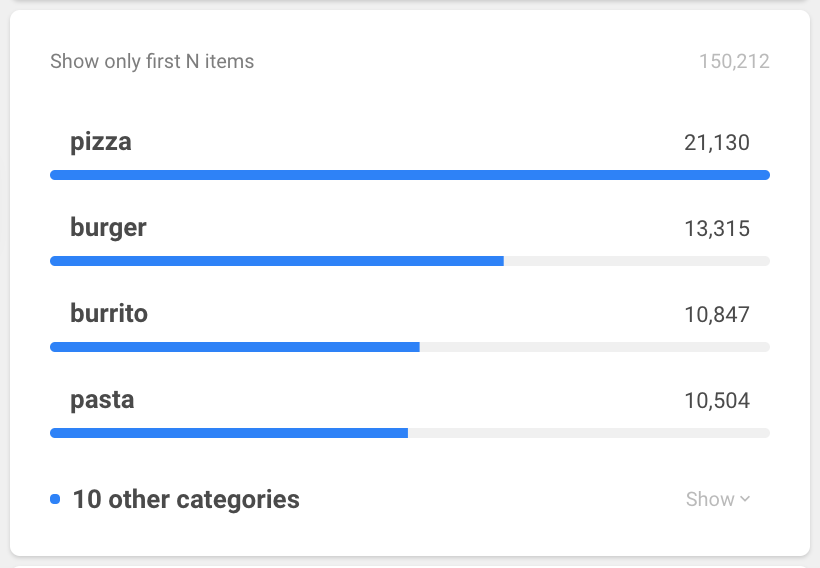
Categories can limit number of displayed items
It is possible to limit the number of categories in Categories block. Other categories are displayed together as Other.
Modified map URLs
Selected objects and indicator drills are not updated in the URL. Use Share function instead to create links to any map state.
This brings improved performance and smoother transitions when user selects any objects on the map.
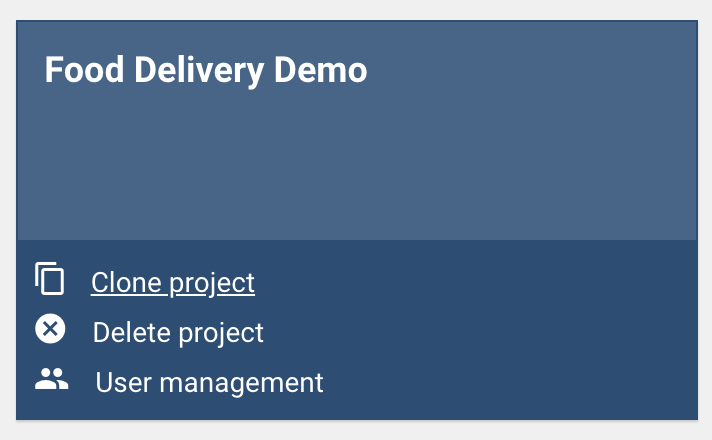
Clone project
User with role administrator is allowed to clone project directly from Project list.
Authentication with custom Identity Provider
It is possible to set up any company’s Identity provider to be used for logging to our platform. Discuss it with our support if you’re interested.
Minor fixes and improvements
Fixed scrollbar in filter dropdown in Data model preview.
all of the columns will fit on the view if there are many of them
Qualitative visualization use stripe pattern to visualize first N categories with the same value.
Formerly, one from the first N was used randomly as the top category for visualization.
2020-06-01
New features and improvements
Open location in 3rd party app
Google Satellite, Google StreetView, Mapy.cz Ortophoto, Mapy.cz Panorama, ČÚZK Parcel Informations
Open context menu with right click anywhere in the map. It is not available by default - has to be set up in metadata.
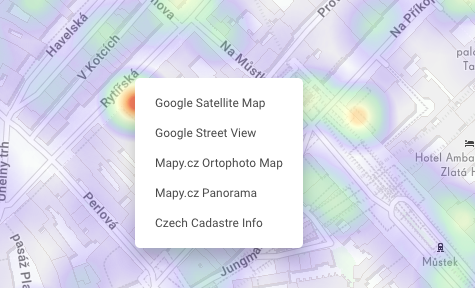
See it in action in Exposure Index Demo.
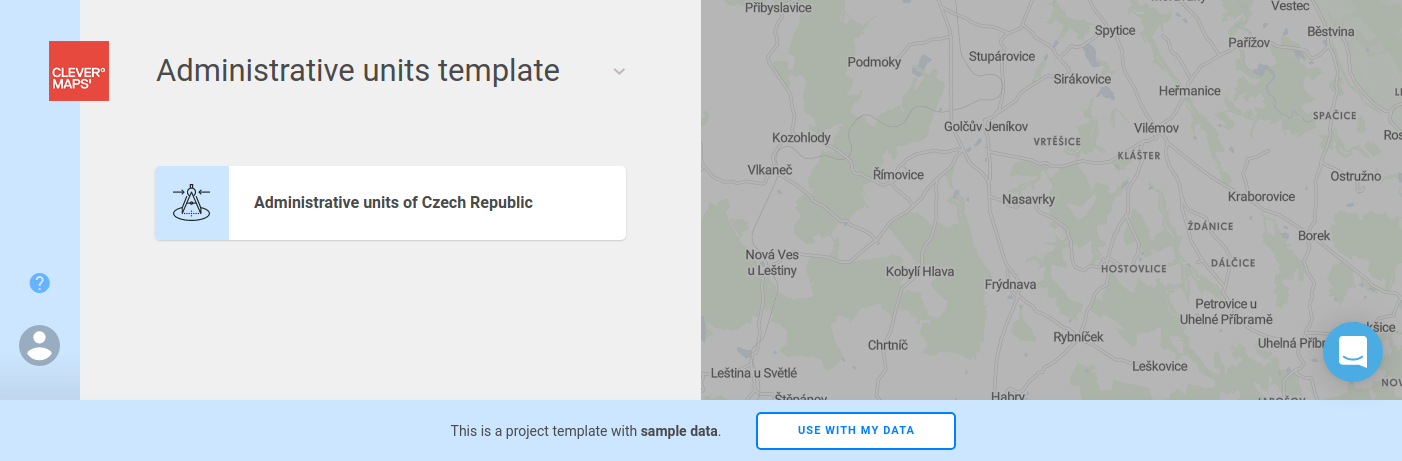
Business user can create project from Template and load own data.
Templates are our simplified projects targeting some specific use-case
Alphabet symbols are available as symbols inside markers.
It brings another way to differentiate between many marker types.
Details and pictures can be found in Markers documentation.
Enabled travel time selection of Marker or Dotmap objects.
Measure tool Isolines were enhanced with selection functionality for point datasets - available automatically.
Selection is currently limited to 500 objects
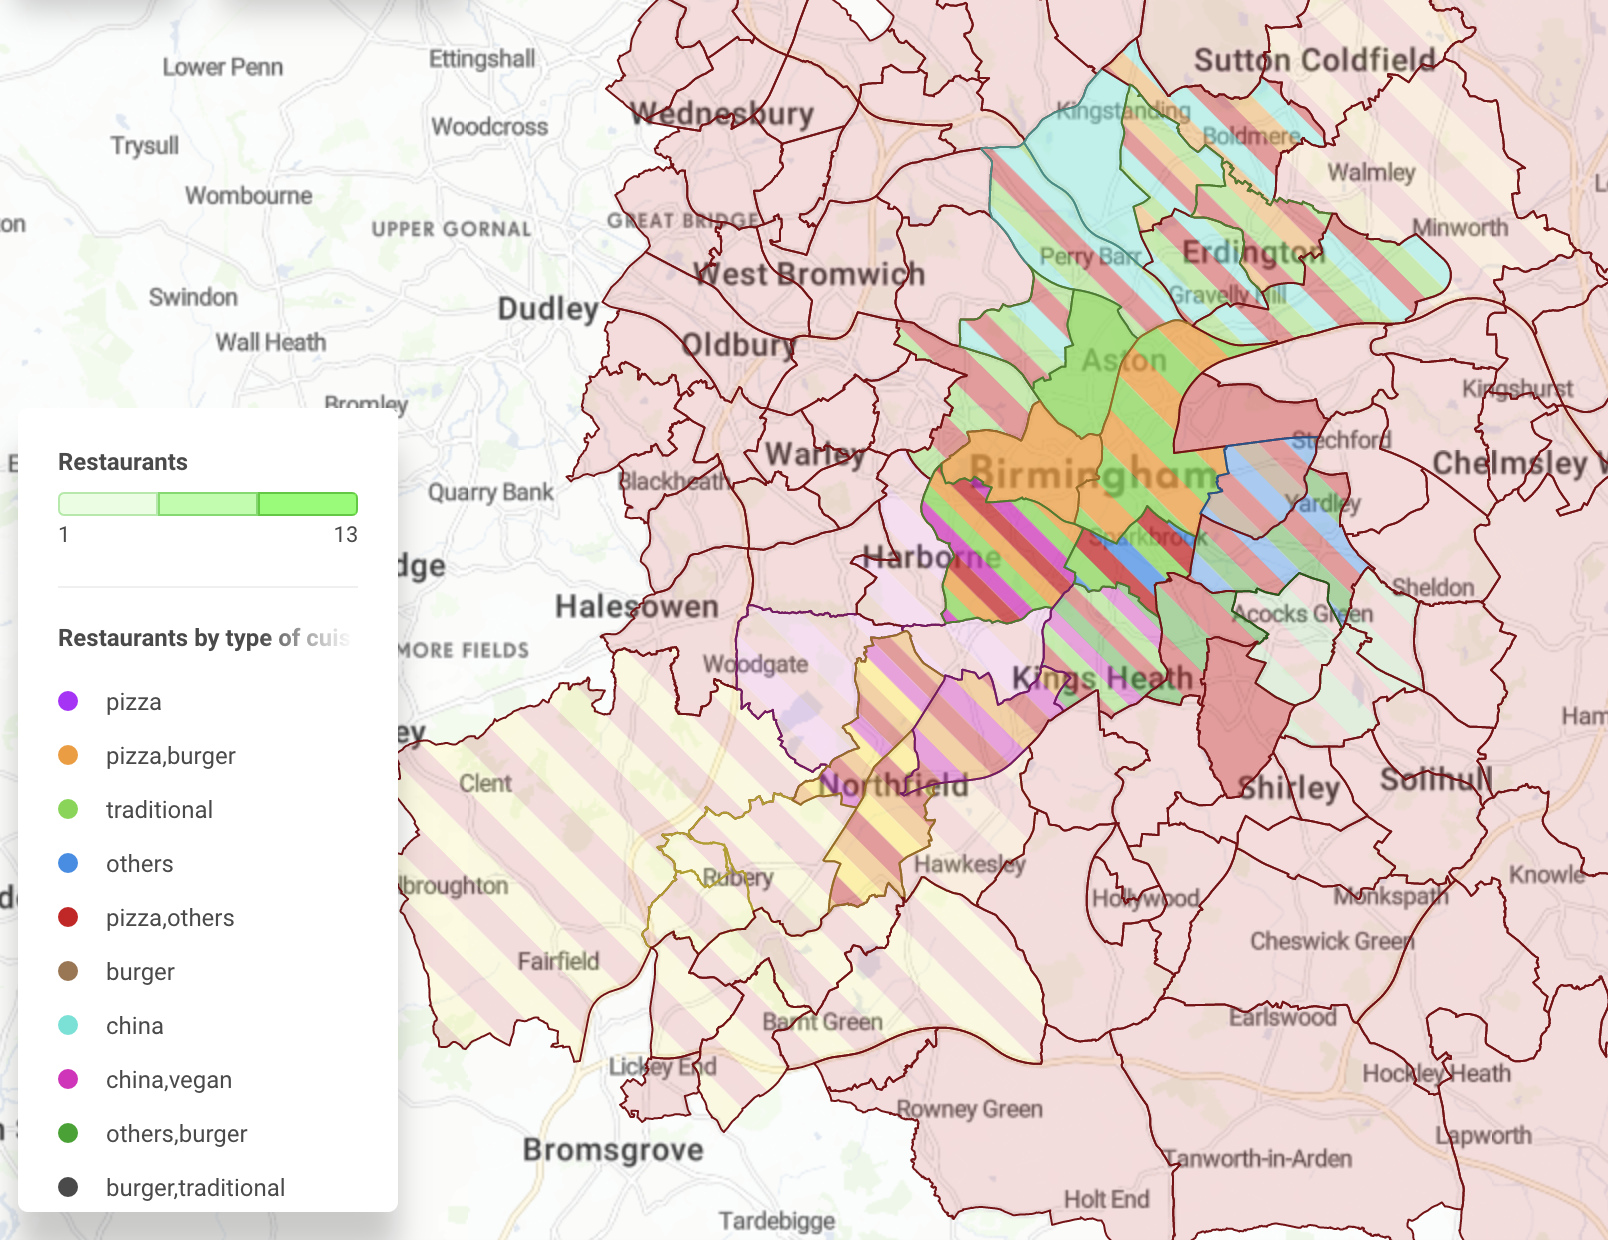
Lines can be styled with color, weight and pattern without Categories with Indicator, only by data attribute.
See the examples in Marker selectors documentation.
Interactive example is available as a view in Feature Catalog project.
Update width of lines proportionally according to map zoom
Improves readability and interaction with line visualization.
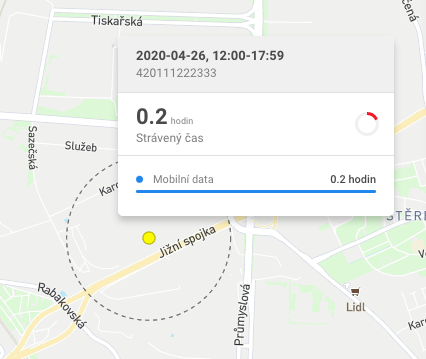
Dotmap layer is able to display accuracy circle for any dot when you hover over it.
Useful to display mobile data accuracy etc.
See the featureAccuracy metadata in Datasets documentation.
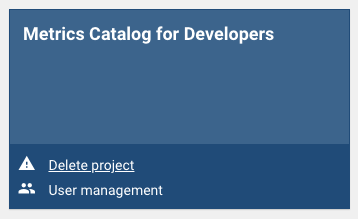
User with role administrator can delete project directly from Project list page.
It's easier to remove outdated or test projects that are no longer needed.
It’s possible to display dataset featureAttributes on indicator drill
See the metadata in Views (showAttributesOnDrill property)
Minor fixes and improvements
Export support indicators with same title
Improved menus on Project list page and added Help menu to Project page
2020-04-27
New features and improvements
Added new localization – Slovak
Upload CSV data button in Data model Dataset view available for project Administrators.
Each dataset data can be uploaded from UI, if user has correctly formatted CSV file.
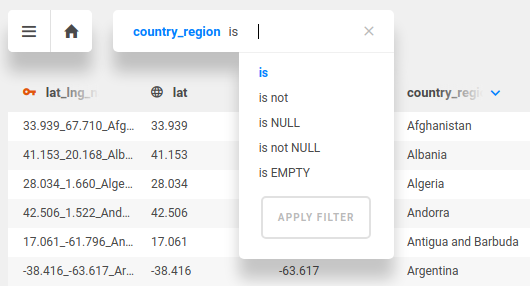
Improved filters in Data Model – enabled filtering NULL values and empty strings.
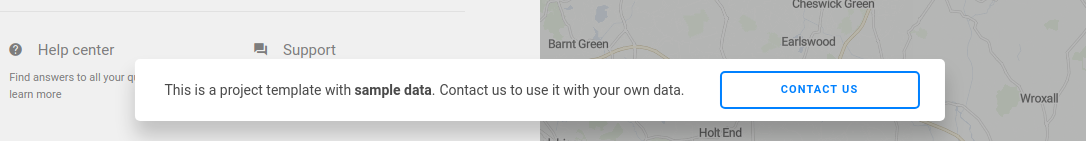
Demo projects have new Template banner with call to action button “Contact us”.
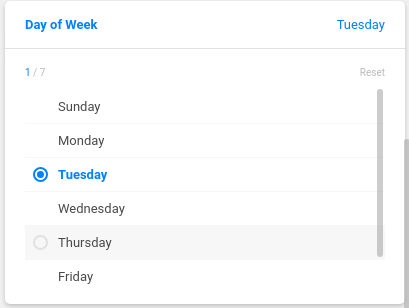
Single select filter (Views)
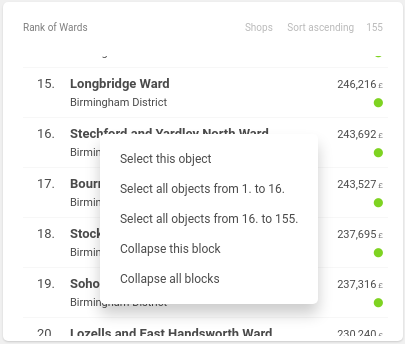
Selections from Ranking
3rd party map links (Views)
Minor fixes
Unified Reset all filters and Reset to defaults labels. (The label now says "Reset all filters to defaults".)
Fixed MultiSelect filter label in header.
Fixed Reset to defaults for Variables.
Fixed interaction with Benchmarks in TimeSeries. Dropdown list with Benchmarks was trimmed if it was too long.
2020-03-30
New features and improvements
Share
enables to easily present, report and share current state of view with other users
https://help.clevermaps.io/en/articles/3695146-share-current-state-of-view
Filters
Enabled quick reset of active Filters directly from map (in blue filters badge).
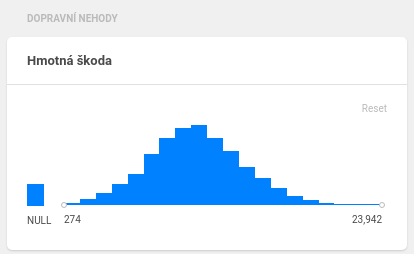
NULL values in histogram filter
Extra histogram column is visible only if filter property has some NULL values.
By default, nothing is filtered – all NULL value records are included.
Shell
Multipart Upload
enables to upload any size CSV file
not default, usage: specify
--multipartparameter inloadCsvorpushProjectcommands
New shell command -
setup. Allows user to setup config and credentials files with single command (without creating file system files).Since 1.3.9-RELEASE
New metadata options
Default state of keepFiltered settings in the Visibility tool.
The defaults keep markers unfiltered and granularity filtered.
Setting filterable in Marker categories is now deprecated in favor of this new option.
Details can be found in Marker selectors metadata docs.
Default Object filters (normally added from map selection).
Add to docs
Default Time series period.
Details can be found in Indicator drill metadata docs.
Default Compare type (Dominance or Overlap)
Set the value defaultCompareType in View metadata.
Default Measure tool state
Default Lines or Isolines panel
Default settings in panels (e.g. the default zone for Isolines measuring)
Details can be found in View metadata docs.
Default Ranking block state
Markers or Granularity objects
Ascending or descending
Details can be found in Indicator drill metadata docs.
Added hint to Indicator group header, fixed overflow.
It is easier to describe indicator group in more detail, just add the attribute description.
Details can be found in Dashboard metadata docs.
Default Distribution block state
Default range and breaks for standard dynamic distribution. It’s active on first load and reset when user changes filters, selects other objects etc.
staticOptions are not affected by other actions in view vs defaultDistribution breaks setting is affected by other actions in view
Minor fixes
Fixed definition of “default settings” and “filtered” in all filter types.
Reset always reverts filters to default setting
No badge on Filter icon only if nothing is filtered
Each filter is counted as “filtered”, if it basically filters something. If default setting filters some data, it is counted as well.
Fixed collapse/expand all blocks feature.
Save defaultTool (Search, Visibility, Measure…) for sharing, fixed loading if some feature is selected.
2020-02-24
New features and improvements
Data model
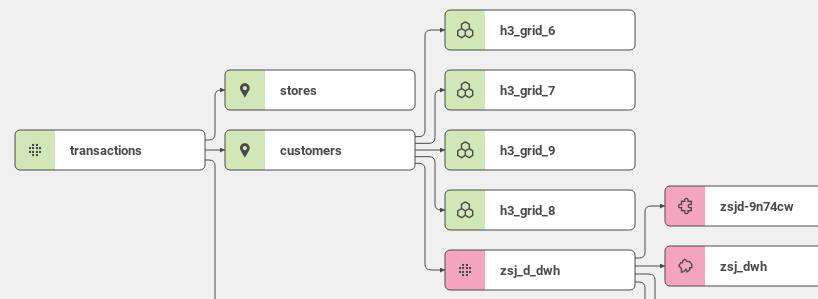
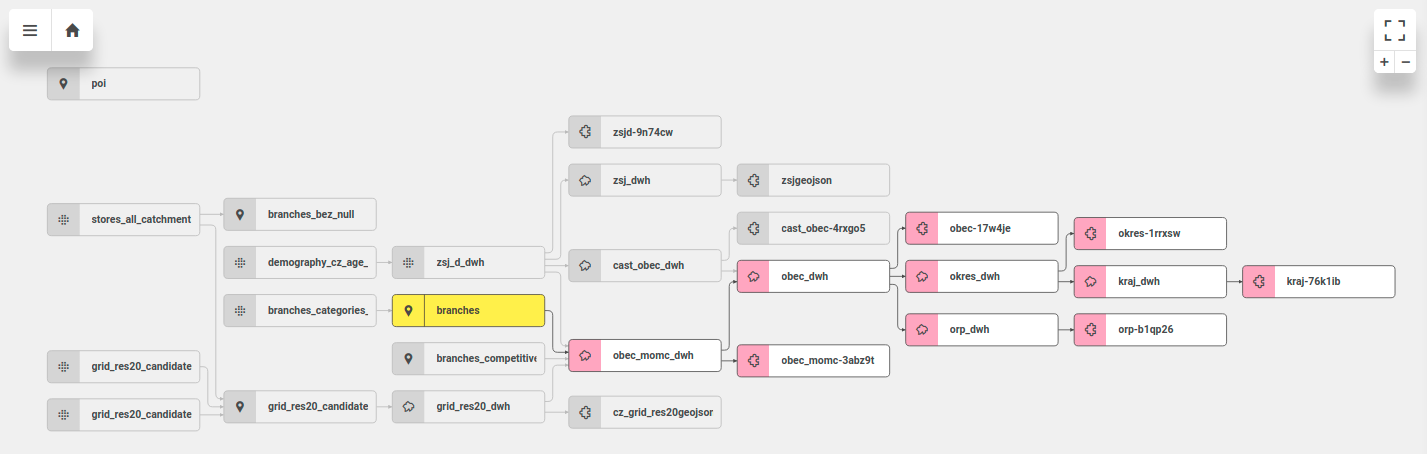
We have improved user interaction with Data model schema. You can use it in similar way as you use our map – mouse scroll works for zooming in or out and dragging can be used to pan the schema.
Relations between datasets in the schema are interactive. In case you select or hover some dataset, all related links and datasets remain active, others are muted. It helps you find the relations in large data models.
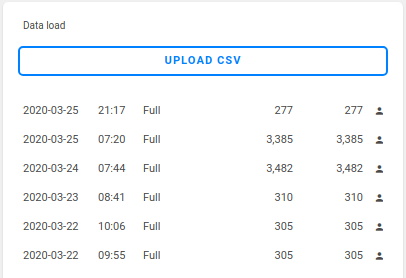
There is a new block Data Load History on the detail of dataset. It is available for administrators of the project. This gives you quick summary of all data modifications in the project. You can see when it happened and who made the change.
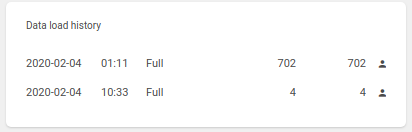
Date of load, time, type (Incremental or Full), count of records added, total count of records, user (details on hover)
You can preview the content of your datasets in with Data preview feature. You can enter this preview in dataset detail in the bottom of the Overview block.
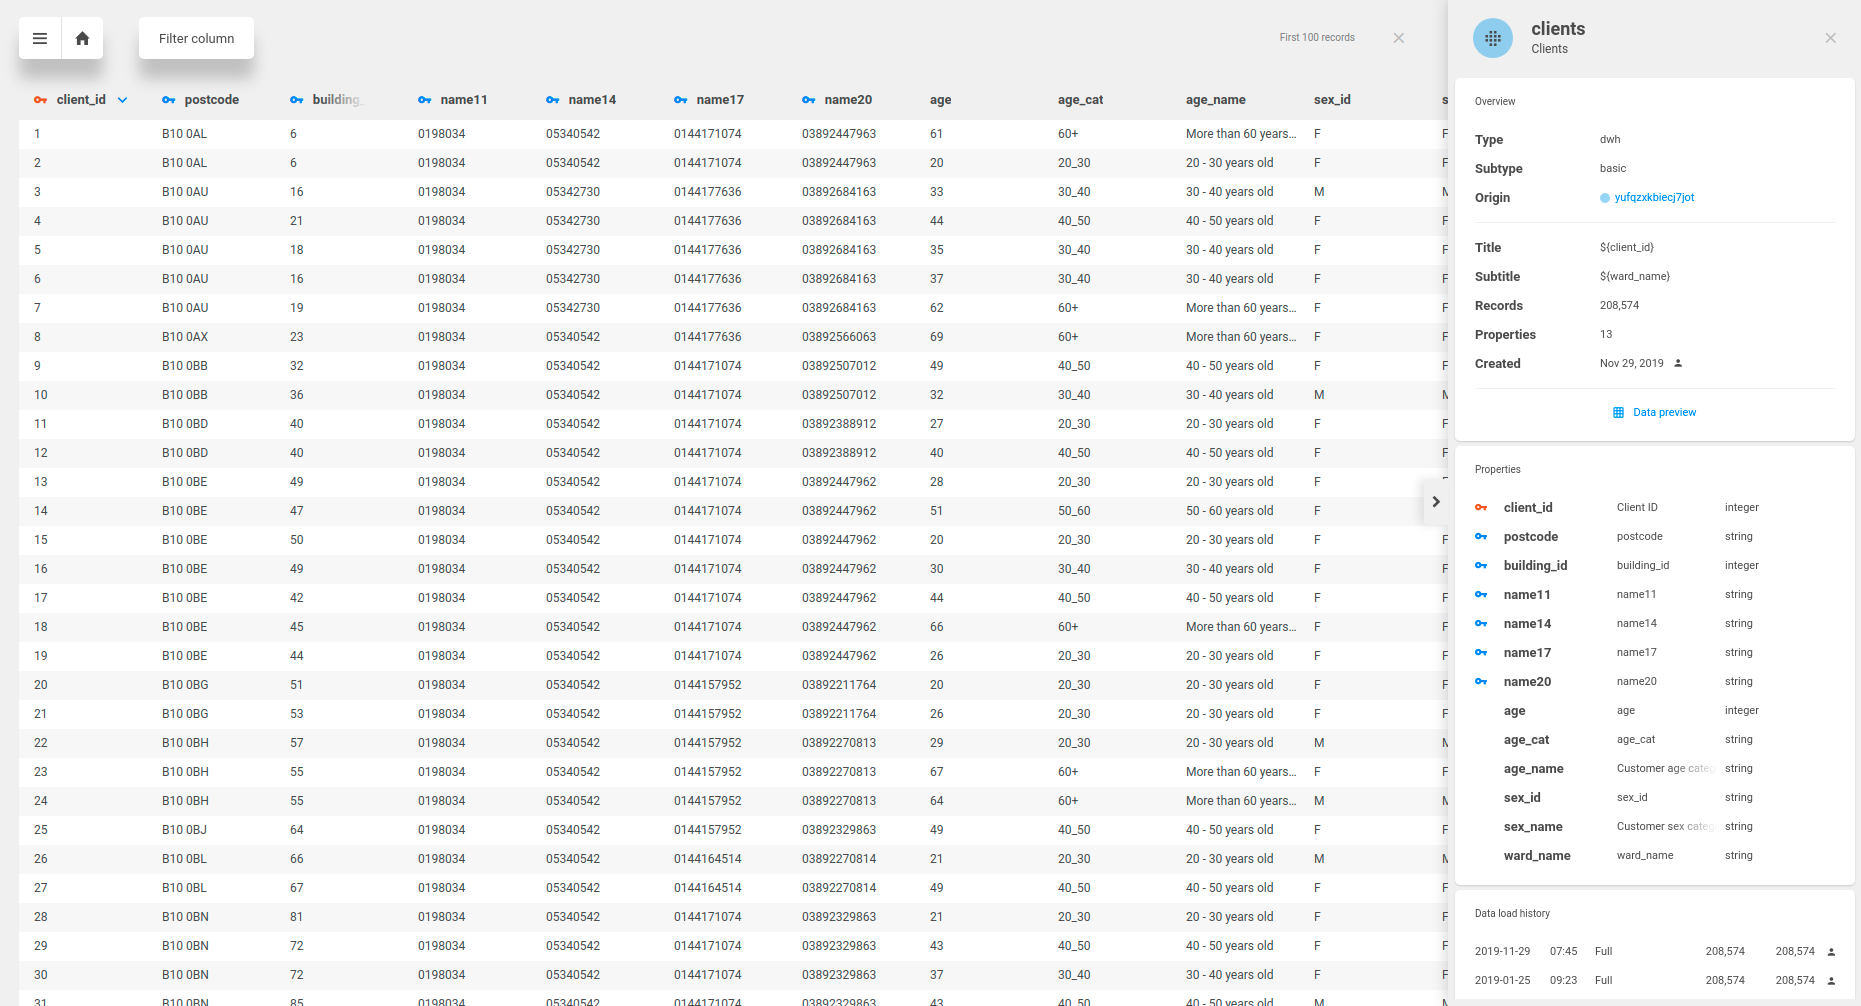
It is possible to sort the records by any column, filter records by property value with equality operator or easily go to linked datasets by clicking on blue key icon. It is useful for checking that your data load was successful or checking the geometry columns if you don’t see your data in the map.
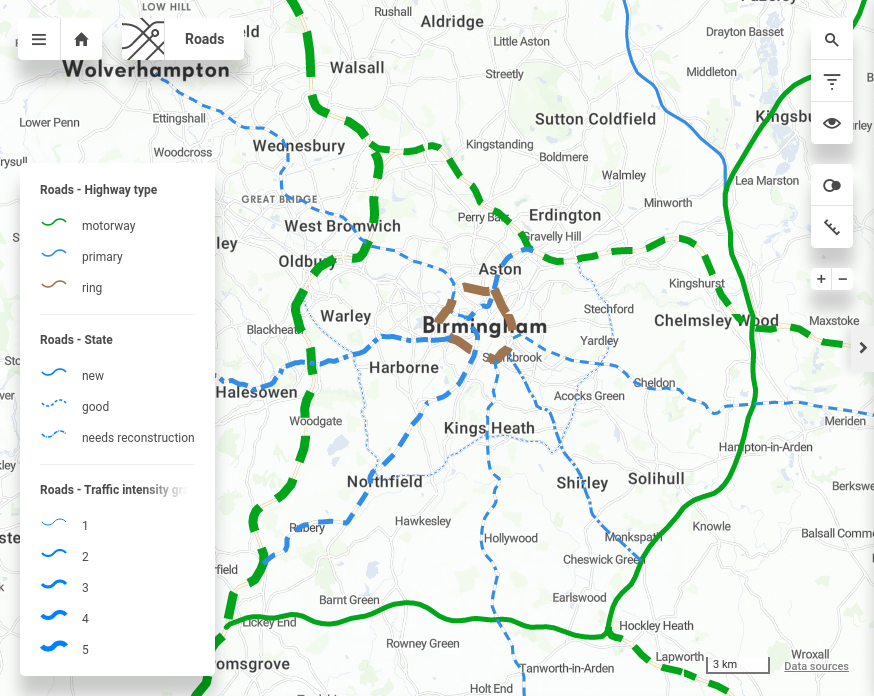
Legend
CleverMaps has completed map legend. It displays not only standard visualization legend, but also markers and qualitative color scales, if it’s turned on. All of that works automatically without any metadata changes.
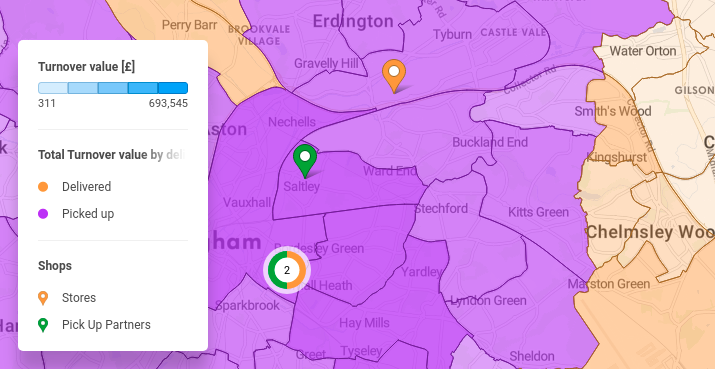
All types of map objects are divided into individual sections, you can collapse each of them or all.
Qualitative visualization legend is interactive like standard visualization legend – hover any object to highlight features in the map that has selected quality.
Block Dominance
Compare tool was completed with block Dominance
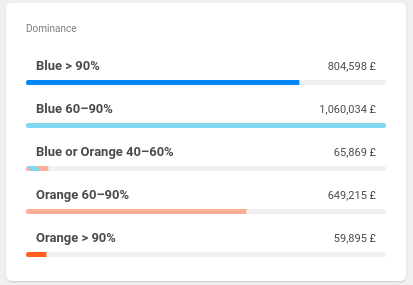
Indicators that have enabled Dominance option have its drill completed with this block automatically.
It is useful to find out how the indicator value is distributed in catchment areas of two compared branches. You can hover the dominance categories to highlight it in the map.
Block with coordinates
...
New block in the Isolines tool.
Displays coordinates of selected point or marker in the map.
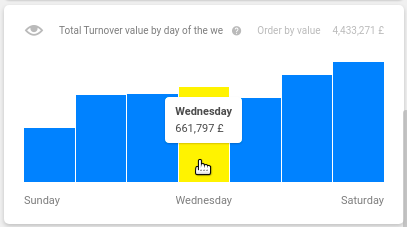
Yellow colour
...
Yellow colour was added to our colour palette.
It is available for markers and also for qualitative visualization.
Use it with caution, since it is similar with standard highlight colour.
Many colour scales where adjusted to represent yellow and highlight color as clearly as possible.
Dedicated DWH
CleverMaps platform has implemented support for Dedicated Data warehouses. This brings improved performance, isolation, scalability and availability for our customers.
Selected projects or customers can use dedicated, custom sized PostgreSQL cluster.
Hit us at info@clevermaps.io if you would like to hear more details.
Performance optimization
Optimized loading of all filters in a view. It can significantly reduce initial map view loading time.
Rewritten marker layers loading and styling. It improves marker loading times, especially in views that use many types of markers for one marker category.
New metadata options
Added option to set filter to disabled state by default.
It can be useful to prepare some initial values of filter, but disable it by default.
Details can be found in View metadata docs.
Enabled setting of default Visualization
Visualization is set automatically if it’s only one possible visualization for dataset. For point datasets, it’s better to set
defaultVisualizationto decide if heatmap or dotmap should be used.Details can be found in View metadata docs.
Enabled setting of default period in block Time series to days, weeks, months quarters or year.
Details can be found in Drill metadata docs.
Enabled setting of featureType, the default feature type in block Ranking. Set
“featureType”: “granularity”or“featureType”: “markers”.Details can be found in Drill metadata docs.
Enabled setting of direction in block Ranking to specify the order of features.
Details can be found in Drill metadata docs.
Minor fixes
...
Fixed null values handling in block Categories.
...
Fixed order of bars with null values in block Categories.
...
Fixed rectangular marker styles in Compare.
...
Fixed some Vector tiles loading issues in map (no blank tiles, improved world level zoom)
...
Fixed some issues with our onboarding Tour (missing popup, z-index…)
...
Fixed style of Missing attribute in Attribute block.
...
Fixed Date filter issue with 29th February.
...
Fixed benchmark dropdown height in block Time series.
...
Optimized query for loading count of records in Data model dataset
...
Fixed content of Exports list – it shows only available exports for current view.
...
Fixed downloading (dump) of large CSV files.
...
Fixed loading of interval counts in block Distribution.
...
| Panel | ||||||||
|---|---|---|---|---|---|---|---|---|
| ||||||||
The content you are trying to reach has been moved here: https://docs.clevermaps.io/docs/release-notesWe are proud to announce that we have launched a new documentation. Please update your saved links and bookmarks to follow a new address docs.clevermaps.io. |