Skip to end of metadata
Go to start of metadata

You are viewing an old version of this page. View the current version.

Compare with Current View Page History

« Previous Version 20 Next »

In this tutorial, we will extend our dashboard with more indicators, and we'll learn about additional dashboard features and formatting.

We'll also learn new metric functions and syntax.

What you'll create

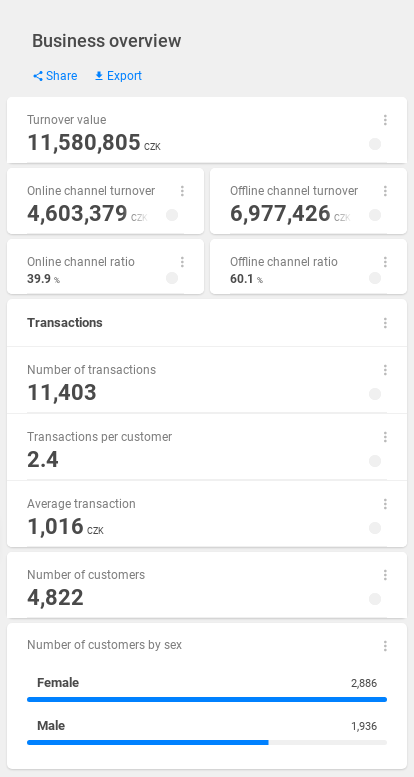
Extended dashboard full of new features and indicators.

Block rows

Our dashboard contains two indicators we've added in the previous tutorial - turnover_indicator and customers_indicator. They're each in a separate block row. Using the blockRow object, we can put two indicators in one row, and thus save some space on the dashboard.

Let's add two more metrics and two more indicators:

  • online_turnover_indicator.json
  • online_turnover_metric.json
  • offline_turnover_indicator.json
  • offline_turnover_metric.json
online_turnover_indicator.jsononline_turnover_metric.json
{
    "name": "online_turnover_indicator",
    "type": "indicator",
    "title": "Online channel turnover",
    "description": "Total turnover generated in the online channel.",
    "content": {
        "metric": "/rest/projects/$projectId/md/metrics?name=online_turnover_metric",
        "scale": "standard",
        "distribution": "geometric",
        "visualizations": {
            "dotmap": true,
            "heatmap": true,
            "areas": true
        },
        "format": {
            "type": "number",
            "fraction": 0,
            "symbol": "CZK"
        }
    }
}

{
    "name": "online_turnover_metric",
    "type": "metric",
    "content": {
        "type": "function_sum",
        "content": [
            {
                "type": "property",
                "value": "transactions.amount"
            }
        ],
        "options": {
            "filterBy": [
                {
                    "property": "transactions.channel",
                    "value": "Online",
                    "operator": "eq"
                }
            ]
        }
    }
}
offline_turnover_indicator.jsonoffline_turnover_metric.json
{
    "name": "offline_turnover_indicator",
    "type": "indicator",
    "title": "Offline channel turnover",
    "description": "Total turnover generated in the offline channel.",
    "content": {
        "metric": "/rest/projects/$projectId/md/metrics?name=offline_turnover_metric",
        "scale": "standard",
        "distribution": "geometric",
        "visualizations": {
            "dotmap": true,
            "heatmap": true,
            "areas": true
        },
        "format": {
            "type": "number",
            "fraction": 0,
            "symbol": "CZK"
        }
    }
}
{
    "name": "offline_turnover_metric",
    "type": "metric",
    "content": {
        "type": "function_sum",
        "content": [
            {
                "type": "property",
                "value": "transactions.amount"
            }
        ],
        "options": {
            "filterBy": [
                {
                    "property": "transactions.channel",
                    "value": "Offline",
                    "operator": "eq"
                }
            ]
        }
    }
}

These metrics use the filterBy option, which allows you to filter metric results based on value of some property. In this case, we'll split our metrics based on the value of transactions.channel property, which is either "Online" or "Offline".

The indicators are similar to turnover_indicator, we've just edited the title and description keys. Add these 4 object using addMetadata.

Now, we have to add these new indicators on the dashboard. We will use the blockRow object, which allows us to put put two indicators in one row.

Expand the code block below to see the updated dashboard

Updated Business overview dashboard
{
    "id": "ltvoi2nghm4dt4jr",
    "name": "business_overview_dashboard",
    "type": "dashboard",
    "content": {
        "blockRows": [
            {
                "type": "indicator",
                "indicator": "/rest/projects/$projectId/md/indicators?name=turnover_indicator",
                "indicatorDrill": "/rest/projects/$projectId/md/indicatorDrills?name=empty_indicator_drill",
                "layout": "primary"
            },
            {
                "type": "blockRow",
                "blocks": [
                    {
                        "type": "indicator",
                        "indicator": "/rest/projects/$projectId/md/indicators?name=online_turnover_indicator",
                        "indicatorDrill": "/rest/projects/$projectId/md/indicatorDrills?name=empty_indicator_drill",
                        "layout": "primary"
                    },
                    {
                        "type": "indicator",
                        "indicator": "/rest/projects/$projectId/md/indicators?name=offline_turnover_indicator",
                        "indicatorDrill": "/rest/projects/$projectId/md/indicatorDrills?name=empty_indicator_drill",
                        "layout": "primary"
                    }
                ]
            },
            {
                "type": "indicator",
                "indicator": "/rest/projects/$projectId/md/indicators?name=customers_indicator",
                "indicatorDrill": "/rest/projects/$projectId/md/indicatorDrills?name=empty_indicator_drill",
                "layout": "primary"
            }
        ]
    },
    "accessInfo": {
        "createdAt": "2020-06-25T12:58:05Z",
        "modifiedAt": "2020-06-29T06:14:41Z",
        "createdBy": "/rest/accounts/00ubfu7fdyIoFKxXm0h7",
        "modifiedBy": "/rest/accounts/00ubfu7fdyIoFKxXm0h7"
    },
    "links": [
        {
            "rel": "self",
            "href": "/rest/projects/k5t8mf2a80tay2ng/md/dashboards/ltvoi2nghm4dt4jr"
        }
    ]
}

Use pushProject to update the dashboard.

Indicator layout

So far, we used only the primary layout of indicators. Let's have a look at the secondary layout, and some more metrics.

Let's add two more metrics and two more indicators:

  • online_ratio_indicator.json
  • online_ratio_metric.json
  • offline_ratio_indicator.json
  • offline_ratio_metric.json
online_ratio_indicator.jsononline_ratio_metric.json
{
    "name": "online_ratio_indicator",
    "type": "indicator",
    "title": "Online channel ratio",
    "description": "The ratio of online transactions and all transactions.",
    "content": {
        "metric": "/rest/projects/$projectId/md/metrics?name=online_ratio_metric",
        "scale": "standard",
        "distribution": "uniform",
        "visualizations": {
            "dotmap": true,
            "heatmap": true,
            "areas": true
        },
        "format": {
            "type": "percentage",
            "fraction": 1
        }
    }
}
{
    "name": "online_ratio_metric",
    "type": "metric",
    "content": {
        "type": "function_divide",
        "content": [
            {
                "type": "function_count",
                "content": [
                    {
                        "type": "property",
                        "value": "transactions.transaction_id"
                    }
                ],
                "options": {
                    "filterBy": [
                        {
                            "property": "transactions.channel",
                            "value": "Online",
                            "operator": "eq"
                        }
                    ]
                }
            },
            {
                "type": "function_count",
                "content": [
                    {
                        "type": "property",
                        "value": "transactions.transaction_id"
                    }
                ]
            }
        ]
    }
}
offline_ratio_indicator.jsonoffline_ratio_metric.json
{
    "name": "offline_ratio_indicator",
    "type": "indicator",
    "title": "Offline channel ratio",
    "description": "The ratio of offline transactions and all transactions.",
    "content": {
        "metric": "/rest/projects/$projectId/md/metrics?name=offline_ratio_metric",
        "scale": "standard",
        "distribution": "uniform",
        "visualizations": {
            "dotmap": true,
            "heatmap": true,
            "areas": true
        },
        "format": {
            "type": "percentage",
            "fraction": 1
        }
    }
}
{
    "name": "offline_ratio_metric",
    "type": "metric",
    "content": {
        "type": "function_divide",
        "content": [
            {
                "type": "function_count",
                "content": [
                    {
                        "type": "property",
                        "value": "transactions.transaction_id"
                    }
                ],
                "options": {
                    "filterBy": [
                        {
                            "property": "transactions.channel",
                            "value": "Offline",
                            "operator": "eq"
                        }
                    ]
                }
            },
            {
                "type": "function_count",
                "content": [
                    {
                        "type": "property",
                        "value": "transactions.transaction_id"
                    }
                ]
            }
        ]
    }
}

This metric tells us what portion of our business is realised through the online/offline channel. This can done by using function_divide and dividing the number of online transactions by the number of all transactions. You can think of this type of metric as a fraction. The numerator is the number of online/offline transactions, and the denominator is the number of all transactions.

The indicators have a different format object. We want to format the metric as a percentage with fraction of 1. We also used a different distribution - uniform.

Add these 4 object using addMetadata.

Extend the dashboard similar to what we've done earlier. We will use the blockRow object, again but we'll set the layout of these indicator to secondary. This means they will appear smaller on the dashboard.

Expand the code block below to see the updated dashboard

Updated Business overview dashboard
{
    "id": "ltvoi2nghm4dt4jr",
    "name": "business_overview_dashboard",
    "type": "dashboard",
    "content": {
        "blockRows": [
            {
                "type": "indicator",
                "indicator": "/rest/projects/$projectId/md/indicators?name=turnover_indicator",
                "indicatorDrill": "/rest/projects/$projectId/md/indicatorDrills?name=empty_indicator_drill",
                "layout": "primary"
            },
            {
                "type": "blockRow",
                "blocks": [
                    {
                        "type": "indicator",
                        "indicator": "/rest/projects/$projectId/md/indicators?name=online_turnover_indicator",
                        "indicatorDrill": "/rest/projects/$projectId/md/indicatorDrills?name=empty_indicator_drill",
                        "layout": "primary"
                    },
                    {
                        "type": "indicator",
                        "indicator": "/rest/projects/$projectId/md/indicators?name=offline_turnover_indicator",
                        "indicatorDrill": "/rest/projects/$projectId/md/indicatorDrills?name=empty_indicator_drill",
                        "layout": "primary"
                    }
                ]
            },
            {
                "type": "blockRow",
                "blocks": [
                    {
                        "type": "indicator",
                        "indicator": "/rest/projects/$projectId/md/indicators?name=online_ratio_indicator",
                        "indicatorDrill": "/rest/projects/$projectId/md/indicatorDrills?name=empty_indicator_drill",
                        "layout": "secondary"
                    },
                    {
                        "type": "indicator",
                        "indicator": "/rest/projects/$projectId/md/indicators?name=offline_ratio_indicator",
                        "indicatorDrill": "/rest/projects/$projectId/md/indicatorDrills?name=empty_indicator_drill",
                        "layout": "secondary"
                    }
                ]
            },
            {
                "type": "indicator",
                "indicator": "/rest/projects/$projectId/md/indicators?name=customers_indicator",
                "indicatorDrill": "/rest/projects/$projectId/md/indicatorDrills?name=empty_indicator_drill",
                "layout": "primary"
            }
        ]
    },
    "accessInfo": {
        "createdAt": "2020-06-25T12:58:05Z",
        "modifiedAt": "2020-06-29T06:14:41Z",
        "createdBy": "/rest/accounts/00ubfu7fdyIoFKxXm0h7",
        "modifiedBy": "/rest/accounts/00ubfu7fdyIoFKxXm0h7"
    },
    "links": [
        {
            "rel": "self",
            "href": "/rest/projects/k5t8mf2a80tay2ng/md/dashboards/ltvoi2nghm4dt4jr"
        }
    ]
}

Use pushProject to update the dashboard.

Indicator group

It's possible to group indicators into collapsible indicator groups. Each indicatorGroup must have a title and can have a description.

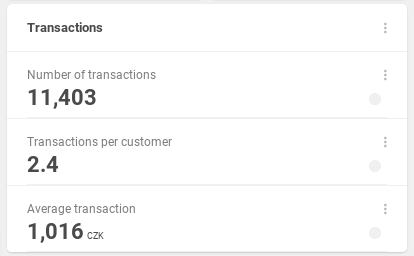
Our indicatorGroup "Transactions" analyzes the transactions using 3 new indicators and metrics. These are:

  • transactions_indicator.json
  • transactions_metric.json
  • transactions_per_customer_indicator.json
  • transactions_per_customer_metric.json
  • average_transaction_indicator.json
  • average_transaction_metric.json

transactions_indicator.json

transactions_metric.json
{
    "name": "transactions_indicator",
    "type": "indicator",
    "title": "Number of transactions",
    "description": "Number of transactions done by our customers",
    "content": {
        "metric": "/rest/projects/$projectId/md/metrics?name=transactions_metric",
        "scale": "standard",
        "distribution": "geometric",
        "visualizations": {
            "areas": true,
            "dotmap": true,
            "heatmap": true
        },
        "format": {
            "type": "number",
            "fraction": 0
        }
    }
}
{
   "name": "transactions_metric",
   "type": "metric",
   "content": {
       "type": "function_count",
       "content": [
           {
               "type": "property",
               "value": "transactions.transaction_id"
           }
       ]
   }
}
transactions_per_customer_indicator.jsontransactions_per_customer_metric.json
{
    "name": "transactions_per_customer_indicator",
    "type": "indicator",
    "title": "Transactions per customer",
    "description": "Number of transactions per one customer.",
    "content": {
        "metric": "/rest/projects/$projectId/md/metrics?name=transactions_per_customer_metric",
        "scale": "standard",
        "distribution": "uniform",
        "visualizations": {
            "areas": true,
            "dotmap": true,
            "heatmap": true
        },
        "format": {
            "type": "number",
            "fraction": 1
        }
    }
}
{
    "name": "transactions_per_customer_metric",
    "type": "metric",
    "content": {
        "type": "function_divide",
        "content": [
            {
                "type": "function_count",
                "content": [
                    {
                        "type": "property",
                        "value": "transactions.transaction_id"
                    }
                ]
            },
            {
                "type": "function_count",
                "content": [
                    {
                        "type": "property",
                        "value": "transactions.customer_id"
                    }
                ]
            }
        ]
    }
}

average_transaction_indicator.json

average_transaction_metric.json
{
    "name": "average_transaction_indicator",
    "type": "indicator",
    "title": "Average transaction",
    "description": "Average transaction amount",
    "content": {
        "metric": "/rest/projects/$projectId/md/metrics?name=average_transaction_metric",
        "scale": "standard",
        "distribution": "uniform",
        "visualizations": {
            "areas": true,
            "dotmap": true,
            "heatmap": true
        },
        "format": {
            "type": "number",
            "fraction": 0,
            "symbol": "CZK"
        }
    }
}
{
    "name": "average_transaction_metric",
    "type": "metric",
    "content": {
        "type": "function_avg",
        "content": [
            {
                "type": "property",
                "value": "transactions.amount"
            }
        ]
    }
}

There's no new syntax in case of transactions_indicator and transactions_metric objects. The transactions_per_customer_metric is a simple fraction. And in average_transaction_metric, we use a new function - function_avg.

What's important is the dashboard syntax update. We will add a the indicatorGroup object containing these three indicators to the blockRows array.

Expand the code block below to see the updated dashboard

Updated Business overview dashboard
{
    "id": "ltvoi2nghm4dt4jr",
    "name": "business_overview_dashboard",
    "type": "dashboard",
    "content": {
        "blockRows": [
            {
                "type": "indicator",
                "indicator": "/rest/projects/$projectId/md/indicators?name=turnover_indicator",
                "indicatorDrill": "/rest/projects/$projectId/md/indicatorDrills?name=empty_indicator_drill",
                "layout": "primary"
            },
            {
                "type": "blockRow",
                "blocks": [
                    {
                        "type": "indicator",
                        "indicator": "/rest/projects/$projectId/md/indicators?name=online_turnover_indicator",
                        "indicatorDrill": "/rest/projects/$projectId/md/indicatorDrills?name=empty_indicator_drill",
                        "layout": "primary"
                    },
                    {
                        "type": "indicator",
                        "indicator": "/rest/projects/$projectId/md/indicators?name=offline_turnover_indicator",
                        "indicatorDrill": "/rest/projects/$projectId/md/indicatorDrills?name=empty_indicator_drill",
                        "layout": "primary"
                    }
                ]
            },
            {
                "type": "blockRow",
                "blocks": [
                    {
                        "type": "indicator",
                        "indicator": "/rest/projects/$projectId/md/indicators?name=online_ratio_indicator",
                        "indicatorDrill": "/rest/projects/$projectId/md/indicatorDrills?name=empty_indicator_drill",
                        "layout": "secondary"
                    },
                    {
                        "type": "indicator",
                        "indicator": "/rest/projects/$projectId/md/indicators?name=offline_ratio_indicator",
                        "indicatorDrill": "/rest/projects/$projectId/md/indicatorDrills?name=empty_indicator_drill",
                        "layout": "secondary"
                    }
                ]
            },
            {
                "type": "indicatorGroup",
                "title": "Transactions",
                "blockRows": [
                    {
                        "type": "indicator",
                        "indicator": "/rest/projects/$projectId/md/indicators?name=transactions_indicator",
                        "indicatorDrill": "/rest/projects/$projectId/md/indicatorDrills?name=empty_indicator_drill",
                        "layout": "primary"
                    },
                    {
                        "type": "indicator",
                        "indicator": "/rest/projects/$projectId/md/indicators?name=transactions_per_customer_indicator",
                        "indicatorDrill": "/rest/projects/$projectId/md/indicatorDrills?name=empty_indicator_drill",
                        "layout": "primary"
                    },
                    {
                        "type": "indicator",
                        "indicator": "/rest/projects/$projectId/md/indicators?name=average_transaction_indicator",
                        "indicatorDrill": "/rest/projects/$projectId/md/indicatorDrills?name=empty_indicator_drill",
                        "layout": "primary"
                    }
                ]
            },
            {
                "type": "indicator",
                "indicator": "/rest/projects/$projectId/md/indicators?name=customers_indicator",
                "indicatorDrill": "/rest/projects/$projectId/md/indicatorDrills?name=empty_indicator_drill",
                "layout": "primary"
            }
        ]
    },
    "accessInfo": {
        "createdAt": "2020-06-25T12:58:05Z",
        "modifiedAt": "2020-06-29T06:14:41Z",
        "createdBy": "/rest/accounts/00ubfu7fdyIoFKxXm0h7",
        "modifiedBy": "/rest/accounts/00ubfu7fdyIoFKxXm0h7"
    },
    "links": [
        {
            "rel": "self",
            "href": "/rest/projects/k5t8mf2a80tay2ng/md/dashboards/ltvoi2nghm4dt4jr"
        }
    ]
}


Categories block

Now, we'll add categories block on our dashboard. Blocks are parts of the indicator drill object. So, this part of this tutorial is a actually sneak peek to the next part.

Categories can split the result of an indicator based on a dataset's property. Similar to how we split online and offline transactions earlier - we'll split customers based on sex.

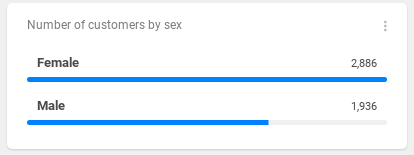
We don't need to add a new indicator, instead we'll use the customers_indicator from the first tutorial. So just add the categories object at the end of the blockRows array.

Expand the code block below to see the updated dashboard

Updated Business overview dashboard
{
    "id": "ltvoi2nghm4dt4jr",
    "name": "business_overview_dashboard",
    "type": "dashboard",
    "content": {
        "blockRows": [
            {
                "type": "indicator",
                "indicator": "/rest/projects/$projectId/md/indicators?name=turnover_indicator",
                "indicatorDrill": "/rest/projects/$projectId/md/indicatorDrills?name=empty_indicator_drill",
                "layout": "primary"
            },
            {
                "type": "blockRow",
                "blocks": [
                    {
                        "type": "indicator",
                        "indicator": "/rest/projects/$projectId/md/indicators?name=online_turnover_indicator",
                        "indicatorDrill": "/rest/projects/$projectId/md/indicatorDrills?name=empty_indicator_drill",
                        "layout": "primary"
                    },
                    {
                        "type": "indicator",
                        "indicator": "/rest/projects/$projectId/md/indicators?name=offline_turnover_indicator",
                        "indicatorDrill": "/rest/projects/$projectId/md/indicatorDrills?name=empty_indicator_drill",
                        "layout": "primary"
                    }
                ]
            },
            {
                "type": "blockRow",
                "blocks": [
                    {
                        "type": "indicator",
                        "indicator": "/rest/projects/$projectId/md/indicators?name=online_ratio_indicator",
                        "indicatorDrill": "/rest/projects/$projectId/md/indicatorDrills?name=empty_indicator_drill",
                        "layout": "secondary"
                    },
                    {
                        "type": "indicator",
                        "indicator": "/rest/projects/$projectId/md/indicators?name=offline_ratio_indicator",
                        "indicatorDrill": "/rest/projects/$projectId/md/indicatorDrills?name=empty_indicator_drill",
                        "layout": "secondary"
                    }
                ]
            },
            {
                "type": "indicatorGroup",
                "title": "Transactions",
                "blockRows": [
                    {
                        "type": "indicator",
                        "indicator": "/rest/projects/$projectId/md/indicators?name=transactions_indicator",
                        "indicatorDrill": "/rest/projects/$projectId/md/indicatorDrills?name=empty_indicator_drill",
                        "layout": "primary"
                    },
                    {
                        "type": "indicator",
                        "indicator": "/rest/projects/$projectId/md/indicators?name=transactions_per_customer_indicator",
                        "indicatorDrill": "/rest/projects/$projectId/md/indicatorDrills?name=empty_indicator_drill",
                        "layout": "primary"
                    },
                    {
                        "type": "indicator",
                        "indicator": "/rest/projects/$projectId/md/indicators?name=average_transaction_indicator",
                        "indicatorDrill": "/rest/projects/$projectId/md/indicatorDrills?name=empty_indicator_drill",
                        "layout": "primary"
                    }
                ]
            },
            {
                "type": "indicator",
                "indicator": "/rest/projects/$projectId/md/indicators?name=customers_indicator",
                "indicatorDrill": "/rest/projects/$projectId/md/indicatorDrills?name=empty_indicator_drill",
                "layout": "primary"
            },
            {
                "type": "categories",
                "title": "Number of customers by sex",
                "description": "Number of customers by sex",
                "splitProperty": "customers.sex",
                "indicator": "/rest/projects/$projectId/md/indicators?name=customers_indicator"
            }
        ]
    },
    "accessInfo": {
        "createdAt": "2020-06-25T12:58:05Z",
        "modifiedAt": "2020-06-29T06:14:41Z",
        "createdBy": "/rest/accounts/00ubfu7fdyIoFKxXm0h7",
        "modifiedBy": "/rest/accounts/00ubfu7fdyIoFKxXm0h7"
    },
    "links": [
        {
            "rel": "self",
            "href": "/rest/projects/k5t8mf2a80tay2ng/md/dashboards/ltvoi2nghm4dt4jr"
        }
    ]
}

(tick) That's it! You now have a beautiful dashboard in your project. In the next tutorial, we'll take a look at various ways of filtering the data. 

  • No labels