Datasets describe the data model of a project. Each dataset represents a database table. They also define the constraints and links between all other datasets in a project.
There are three types of datasets:
dwh( ) type is a data warehouse service dataset type, it references a table in a relational dwh database, which may contain various kinds of data (e.g. orders, customers, administrative units...)
vt( ) type is a vector tile dataset type, it references a vector tile service, which serves vector tiles that are displayed over the base map (CleverMaps vector tiles are hosted on Mapbox)
h3Grid( ) type is a H3 grid dataset, it represents a grid visualization, where the geometries are generated on the fly by the application (see Tutorial 8 for more info, and H3 grid spatial index by Uber)
Datasets of dwh type also have a subtype, which defines the type of data they contain. There are five of them:
basic() subtype is used to contain data which are not to be visualised on a map (e.g. orders, clients, or demography)geometryPolygon( ) subtype contains data which represent polygons on a map (e.g. administrative units, delivery zones)
geometryPoint ) subtype contains data which represent specific points on a map (e.g. shops, postcodes, or POIs)
geometryLine( ) subtype contains data which represent lines on a map (e.g. routes, pipelines)
date( ) subtype is a special subtype not to be used in a regular way, it is used to describe datasets the can-dim-dates data dimension
Datasets also subject to various validation checks. Datasets with ref.subtype other than basic - geometryPolygon, geometryPoint, geometryLine and date must also contain properties.featureTitle key, which defines the format of visualisation of one row of the dataset (used in tooltips or the date picker). Datasets with geometry must have a link to a vt type dataset describing that geometry. More about these checks in the examples below.
Datasets are directly referencing other datasets via foreignKey property or geometry key. They are referenced by URL in marker selectors, as some datasets represent a group of points in the map. Dataset properties, declared in dataset.ref.properties are referenced by name in metrics, view filters and indicator drills. Reference integrity of the data model is also enforced. In order not to break this integrity, is not possible to delete a dataset, which is referenced in another dataset, either by foreignKey, or geometry.
Syntax
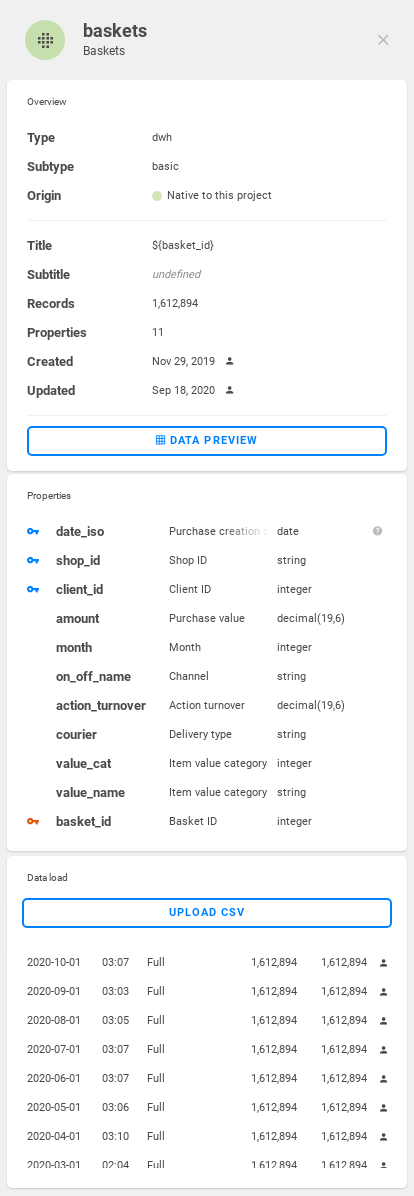
Example of a dwh dataset with basic subtype. This subtype typically indicates a dataset, which does not have a geographical information - so it is not possible to visualise it on the map.
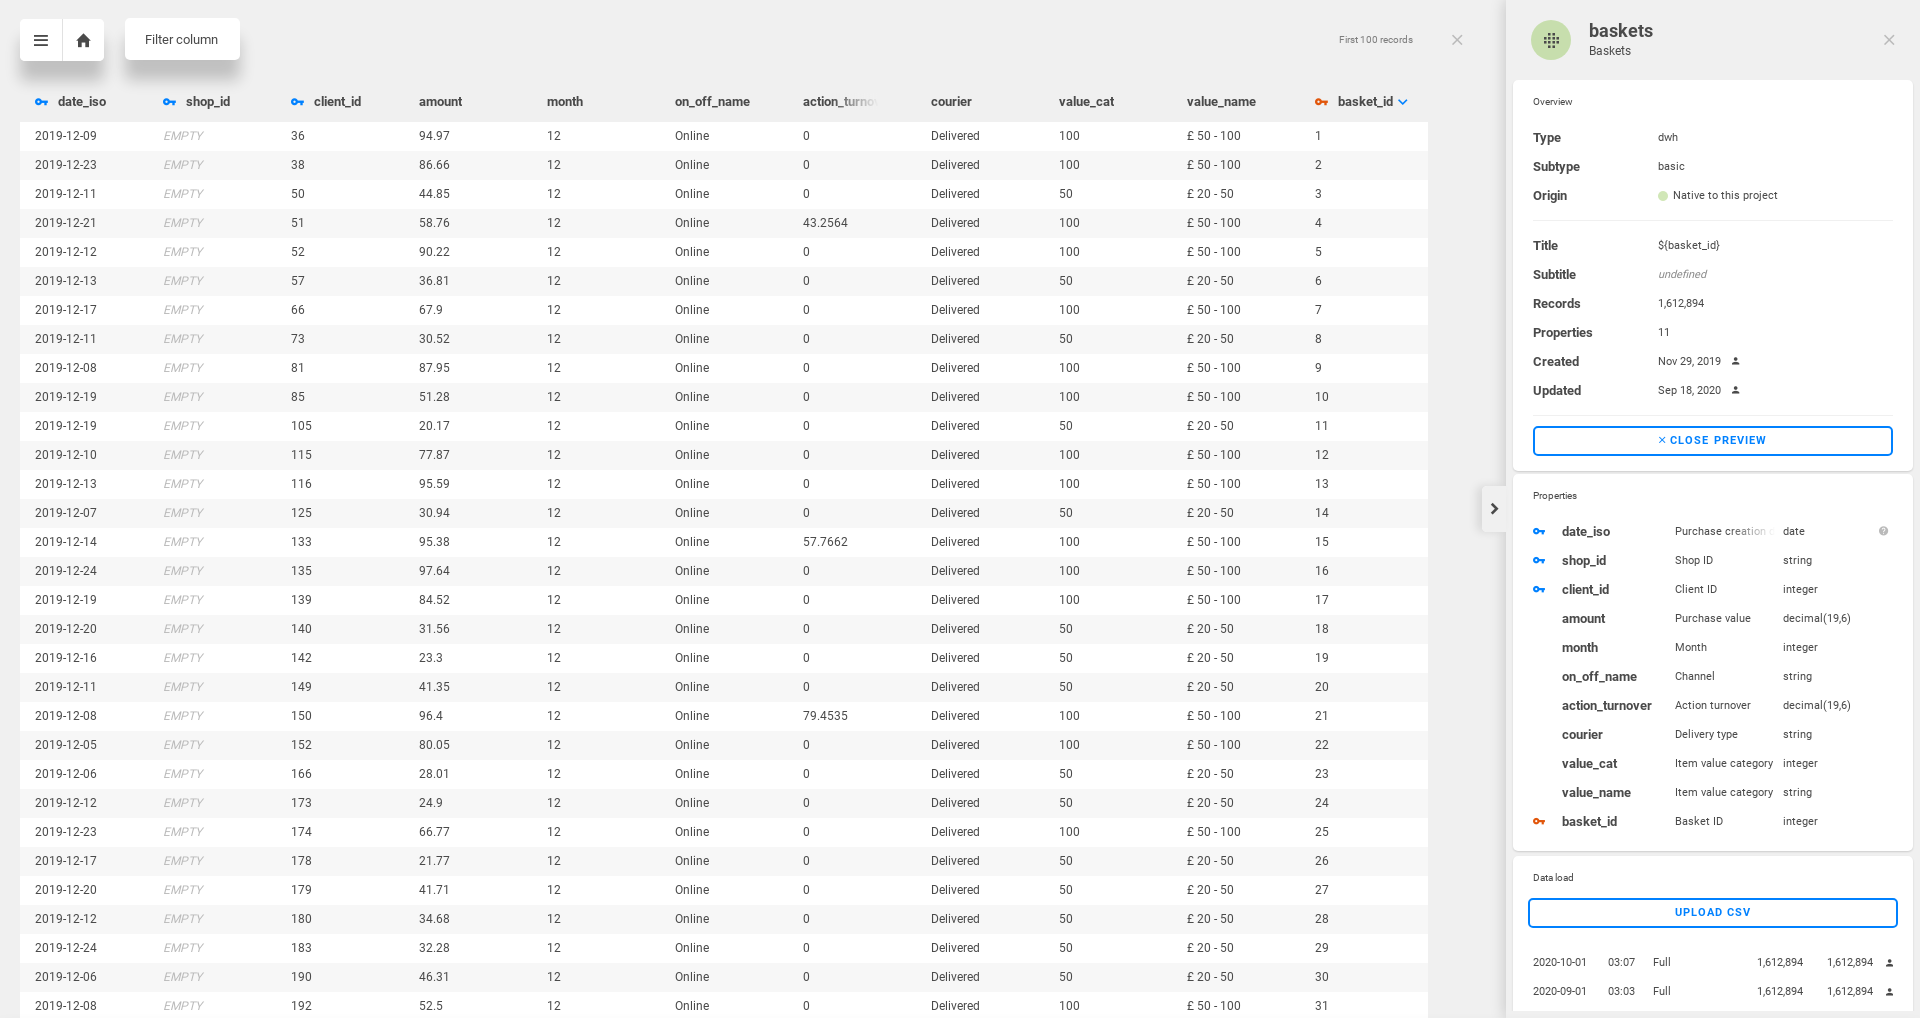
This dataset describes baskets (i.e. orders) from the Retail Solution Demo project. Each basket represents a purchase made by a customer, either offline in one of the shops, or online in the e-shop. You can see that it contains various purchase properties like "Date", "Purchase value", "Delivery type", etc.
{
    "name": "baskets",
    "type": "dataset",
    "title": "Baskets",
    "properties": {
        "featureTitle": {
            "type": "property",
            "value": "basket_id"
        }
    },
    "ref": {
        "type": "dwh",
        "subtype": "basic",
        "table": "baskets",
        "primaryKey": "basket_id",
        "categorizable": true,
        "fullTextIndex": false,
        "properties": [
            {
                "filterable": true,
                "name": "date_iso",
                "title": "Date ISO",
                "column": "date_iso",
                "type": "string"
            },
            {
            	"filterable": false,
                "name": "shop_id",
                "title": "Shop ID",
                "column": "shop_id",
                "type": "integer"
            },
            {
            	"filterable": false,
                "name": "client_id",
                "title": "Client ID",
                "column": "client_id",
                "type": "integer"
            },
            {
            	"filterable": true,
                "name": "amount",
                "title": "Purchase value",
                "column": "amount",
                "type": "decimal(16,2)"
            },
            {
            	"filterable": true,
                "name": "month",
                "title": "Month",
                "column": "month",
                "type": "integer"
            },
            {
            	"filterable": true,
                "name": "on_off_name",
                "title": "Channel",
                "column": "on_off_name",
                "type": "string"
            },
            {
            	"filterable": true,
                "name": "action_turnover",
                "title": "Action turnover",
                "column": "action_turnover",
                "type": "decimal(16,2)"
            },
            {
            	"filterable": true,
                "name": "courier",
                "title": "Delivery type",
                "column": "courier",
                "type": "string"
            },
            {
            	"filterable": false,
                "name": "value_cat",
                "title": "Item value category",
                "column": "value_cat",
                "type": "integer"
            },
            {
            	"filterable": true,
                "name": "value_name",
                "title": "Item value name",
                "column": "value_name",
                "type": "string"
            },
            {
            	"filterable": false,
                "name": "basket_id",
                "title": "Basket ID",
                "column": "basket_id",
                "type": "integer"
            }
        ]
    }
}
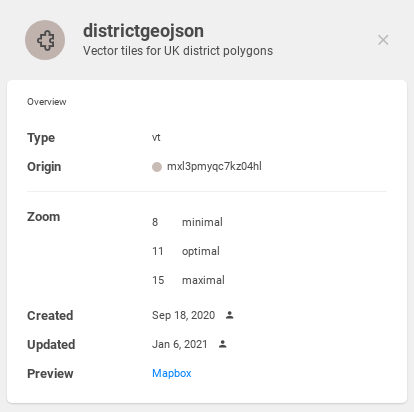
This dataset describes the geometries of UK districts. These geometries are served to the application and visualised as polygons on the map. This geometry is referenced in a dwh dataset district in the examples below.
{
    "name": "districtgeojson",
    "type": "dataset",
    "title": "Vector tiles for UK district polygons",
    "ref": {
        "type": "vt",
        "urlTemplate": "https://a.tiles.mapbox.com/v4/cleveranalytics.dia058st/{z}/{x}/{y}.vector.pbf?access_token={token}",
        "zoom": {
            "min": 8,
            "optimal": 10,
            "max": 15
        }
    },
    "dataSources": [
        {
            "licenceHolder": "Office for National Statistics",
            "licenceHolderUrl": "https://www.ons.gov.uk/",
            "licenceUrl": "http://www.nationalarchives.gov.uk/doc/open-government-licence/version/3/"
        }
    ]
}
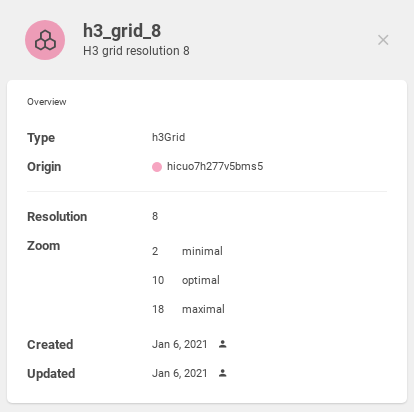
This dataset represents H3 grid visualization on resolution 8. It's very similar to vt dataset, apart from resolution you only need to define appropriate zoom. See Example to see how to link this dataset to a geometryPoint dwh dataset.
{
    "name": "h3_grid_8",
    "type": "dataset",
    "title": "H3 grid resolution 8",
    "ref": {
        "type": "h3Grid",
        "resolution": 8,
        "zoom": {
            "min": 2,
            "optimal": 10,
            "max": 18
        }
    }
}
Additional syntax examples
Important - to properly understand datasets, please see the examples below.
This dwh dataset represents locations of stores. Each store has a location (lat and lon properties), and is visualised by a marker. So, in this case the "subtype" is "geometryPoint".
In geometryPoint subtype, the presence of ref.properties called lng of longitude and lat of latitude type is enforced.
_
This dataset represents dwh data of the districts of the United Kingdom. Districts have a geometry, so they can be visualised as polygons on the map. Thus, "subtype" is "geometryPolygon".
The dataset also contains information about its data sources. The source data for UK districts was provided by Office for National Statistics under the Open Government license. For more info, see the syntax below.
Note the reference to a vt dataset named districtgeojson in ref.properties.geometry key. This dataset must exist in the project before we add the geometryPolygon one.
_
This dataset represents a gas pipeline network. The pipelines are visualised by lines, so "subtype" is "geometryLine". However, remember that the actual geometries are described by the pipelines_geojson vt dataset.
_
This is an example of the date subtype dataset. This subtype is almost exclusively used in the can-dim-dates dimension, used for date management and filtering in a project.
This subtype also enforces the presence of the featureTitle property. The property selected as a featureTitle defines what date will be show in the date picker, or the time series indicator drill block. This is useful in cases when you want to use the date names in different language. The can-dim-dates dimension currently offers either English (date_en) or Czech (date_cz).
_
This dataset has the displayOptions.valueOptions object set on some properties. These are the properties that are also used in a categories block in any linked indicator drill. This gives you the ability to use the qualitative visualization (more info in Tutorial 5: Drilling down on the data).
For example, the baskets.on_off_name property has two possible values: "Online" and "Offline". So the objects with prevailing "Online" value will become green, and objects with prevailing "Offline" will become red.
This is a simple dwh geometryPoint dataset which contains addresses with latitude and longitude. To visualize it using H3 grid, simply add some h3Grid datasets and specify them in the ref.h3Geometries array.
Notice the concat function in featureTitle. This function allows you to concat multiple properties and text to be displayed in the dataset's features tooltip and headers.
Key description
properties
These properties define the content of a tooltip shown on marker/area hover (example), and the details of a dataset (example).
The properties can be found on the common syntax level. The syntax example can be found in the "Example of a dwh dataset type with geometryPoint subtype" above.
Do not confuse these properties with dataset (dwh) properties - dwhDataset.ref.properties array.
| Key | Type | Optionality | Description | Constraints |
|---|---|---|---|---|
featureTitle | object | OPTIONAL | defines the tooltip title shown on hover | |
| object | OPTIONAL | defines the tooltip subtitle shown on hover | |
featureAttributes | array | OPTIONAL | defines the properties which will be displayed in the details | |
featureAccuracy | object | OPTIONAL | defines the property which contains accuracy radius value see visual representation below |
properties.featureTitle & properties.featureSubtitle
The syntax of featureTitle and featureSubtitle is identical.
| Key | Type | Optionality | Description | Constraints |
|---|---|---|---|---|
type | object | REQUIRED |
| [property, function] |
| object | REQUIRED | name of the dataset property, or the function (currently only | |
content | array | OPTIONAL | allows you to nest properties in functions |
properties.featureAttributes
The definition of the dataset details. Allows you to display properties of a dataset itself. These can be properties which are not explicitly to be used in a metric (e.g. store owner, opening hours, area, etc.).
| Key | Type | Optionality | Description | Constraints |
|---|---|---|---|---|
type | object | REQUIRED |
| [property, expression] |
| object | REQUIRED | name of the dataset property | |
format | object | OPTIONAL | object specifying formatting of the attribute value | |
layout | string | OPTIONAL | attribute layout size |
|
properties.featureAttributes.format
| Key | Type | Optionality | Description | Constraints |
|---|---|---|---|---|
type | string | REQUIRED | formatting type | [text, number, percentage, email, link] |
fraction | integer | OPTIONAL | the number of places after the decimal point (for | x => 0 |
symbol | string | OPTIONAL | custom symbol to display with the attribute (e.g. "m2", "$", etc.) |
|
properties.featureAccuracy
This object defines an accuracy of a feature. When hovering the feature, a circle with radius specified in given property is shown. See example below.
It's not possible to specify content, otherwise the syntax is identical to featureTitle.
| Key | Type | Optionality | Description | Constraints |
|---|---|---|---|---|
type | object | REQUIRED | type identifier, always | [property] |
| object | REQUIRED | name of the dataset property which contains the radius value in meters |
dataSources
In this array, you can specify a list of data sources / licences for each dataset. This includes the licence holder's name, webpage, logo and the link to the licence itself. The unique list of data sources for each project can be displayed by clicking on:
- the Menu button in the top left corner (
 ) and selecting "Data sources"
 - selecting "Data sources" in the bottom right corner of the map window
| Key | Type | Optionality | Description | Constraints |
|---|---|---|---|---|
licenceHolder | string | REQUIRED | Name of the licence holder | (*) |
licenceHolderUrl | string | REQUIRED | URL link to the licence holder's website | (*) |
licenceHolderLogo | string | OPTIONAL | URL link to the licence holder's logo preferrably .png, will be downsized automatically |
|
licenceUrl | string | OPTIONAL | URL link to the licence itself | (*) |
dwh.ref
A reference of a dataset dwh type.
| Key | Type | Optionality | Description | Constraints |
|---|---|---|---|---|
type | string | REQUIRED | type identifier, always dwh | [dwh] |
| string | REQUIRED |
| [basic, geometryPoint, geometryPolygon, geometryLine, date] |
geometry | string | VARIES | geometry reference to a vector tile dataset required only for | {datasetName} |
h3Geometries | array | OPTIONAL | array of references to enables the grid visualization | |
visualizations | array | VARIES | array of objects specifying the allowed visualizations of the dataset required only for | |
zoom | object | OPTIONAL | map zoom object | |
table | string | READ-ONLY | name of the actual it's derived from the name of the dataset, and _X postfix is added for each full load, where X is the number of the load | (a-z0-9_-) |
primaryKey | string | REQUIRED | primary key of the table - must be one of the dataset properties should be unique | {datasetProperty} |
categorizable | boolean | OPTIONAL | indicates if the dataset is capable of being categorized in the Filters tool ( default = should be | [true, false] |
fullTextIndex | string | OPTIONAL | indicates if the dataset's data will be indexed for full text search in Search tool ( default = | [true, false] |
properties | array | REQUIRED | array of dataset property order must be identical to the order of the data columns size must be at least 1 |
dwh.ref.visualizations
Array of objects specifying the allowed visualizations of the dataset. The available visualizations are derived from the subtype of the dataset:
geometryPolygonsubtype can be visualized byareas,gridorzonesvisualizationsgeometryPointsubtype can be visualized bydotmaporheatmapvisualizationsgeometryLinesubtype can be visualized bylinevisualization
For more info, see the additional syntax examples above.
| Key | Type | Optionality | Description | Constraints |
|---|---|---|---|---|
type | string | REQUIRED | type of the visualization | [areas, grid, zones, |
dwh.ref.properties
Array of properties describing database table of a dwh dataset.
| Key | Type | Optionality | Description | Constraints |
|---|---|---|---|---|
name | string | REQUIRED | name of the column as it will be referenced in other objects | (a-z0-9_-) |
| string | REQUIRED | human-readable title of the column | (*) |
column | string | REQUIRED | name of the column as it is in the database table | (a-z0-9_-) |
type | string | REQUIRED | column data type detailed description in the table below | [integer, bigint, decimal, string, boolean, date, latitude, longitude] |
foreignKey | string | VARIES | name of the dataset, whose if this key is mentioned, | (a-z0-9_-) |
filterable | boolean | OPTIONAL | indicates whether it's possible for this property to be added to a filter default = | [true, false] |
description | string | OPTIONAL | description of the property which appears in Filters ( | (*) |
displayOptions | object | OPTIONAL | options that specify how the property will be displayed |
dwh.ref.properties.displayOptions
The displayOptions object allows you to specify how the property will be displayed. See the example above.
| Key | Type | Optionality | Description | Constraints |
|---|---|---|---|---|
valueOptions | array | OPTIONAL | assigns colors to values of the property |
dwh.ref.properties.displayOptions.valueOptions
In this array, we can assign colors to specific values of the property. The valueOptions array allows you to set your own colors for the qualitative visualization. See Tutorial 5: Drilling down on the data for more info.
| Key | Type | Optionality | Description | Constraints |
|---|---|---|---|---|
value | string | REQUIRED | value of the property | (*) |
color | string | VARIES | predefined color of the property
| [purple, green, orange, blue, turquoise, pink, red, lime, brown, yellow] |
hexColor | string | VARIES | hex color code of the property (e.g.
| (#[a-fA-F0-9]{6}) |
weight | number | OPTIONAL | weight (or "width") of the property
| x => 0 |
pattern | string | OPTIONAL | pattern of the property
| [solid, dot, dash, longdash, dotdash] |
Dataset property data types
| Identifier | Description | Examples |
|---|---|---|
integer | a whole number 4-byte signed number, range: 2-31 .. 2+31 | |
bigint | large range 8-byte signed number, range: 2-63 .. 2+63 | |
decimal | decimal number with precision and scale parameters:
| -1215.0146, 1.02, 4.57, 9546.4164563 |
string | a sequence of characters variable size, limit: 255 characters | "banana", "CleverMaps", "E=mc2", "!@#$%^&" |
boolean | Boolean data type, has two values only 1-byte size | true, false |
date | ISO 8601 date format (preferred), more available formats can be found here 4-byte size, range: 4713 BC .. 5874897 AD |
|
latitude | a geographic coordinate specifying the north-south position of a point on Earth | 49.1872206 |
longitude | a geographic coordinate specifying the east-west position of a point on Earth | 16.6057850 |
Additional decimal type info
Numeric precision refers to the maximum number of digits that are present in the number (i.e. 1234567.89 has a precision of 9).
Numeric scale refers to the maximum number of decimal places (i.e. 123456.789 has a scale of 3).
scale must not be higher than precision, and the default value is decimal(19,6).
vt.ref
A reference of a dataset vt type.
| Key | Type | Optionality | Description | Constraints |
|---|---|---|---|---|
type | string | REQUIRED | type identifier, always vt | [vt] |
urlTemplate | string | REQUIRED | absolute URL link to the location of the vector tiles | (*) |
zoom | object | REQUIRED | map zoom object |
vt.ref.zoom
Set desired zoom levels for the vector tile datasets.
| Key | Type | Optionality | Description | Constraints |
|---|---|---|---|---|
min | integer | REQUIRED | minimal available zoom level | 2 .. 18 |
| integer | REQUIRED | maximal available zoom level | 2 .. 18 |
optimal | integer | REQUIRED | optimal zoom level | 2 .. 18 |
visibleFrom | integer | OPTIONAL | zoom level from which the dataset's feature will be visible
| 2 .. 18 |
h3Grid.ref
A reference of a dataset h3Grid type.
| Key | Type | Optionality | Description | Constraints |
|---|---|---|---|---|
type | string | REQUIRED | type identifier, always h3Grid | [ |
resolution | string | REQUIRED | resolution of the grid | 2 .. 10 |
zoom | object | REQUIRED | map zoom object |
h3Grid.ref.zoom
Set desired zoom levels for the h3Grid datasets.
| Key | Type | Optionality | Description | Constraints |
|---|---|---|---|---|
min | integer | REQUIRED | minimal available zoom level | 2 .. 18 |
| integer | REQUIRED | maximal available zoom level | 2 .. 18 |
optimal | integer | REQUIRED | optimal zoom level | 2 .. 18 |
Visual representation
The data model which the datasets describe, can be considered their visualization. It can be viewed in the application by clicking the Account button on the bottom left of a Project page, and selecting Data model. However, this functionality is available only to users with the Admin user role.
Example of a project's data model
This is the visualization of the data model from the Retail Solution Demo project.
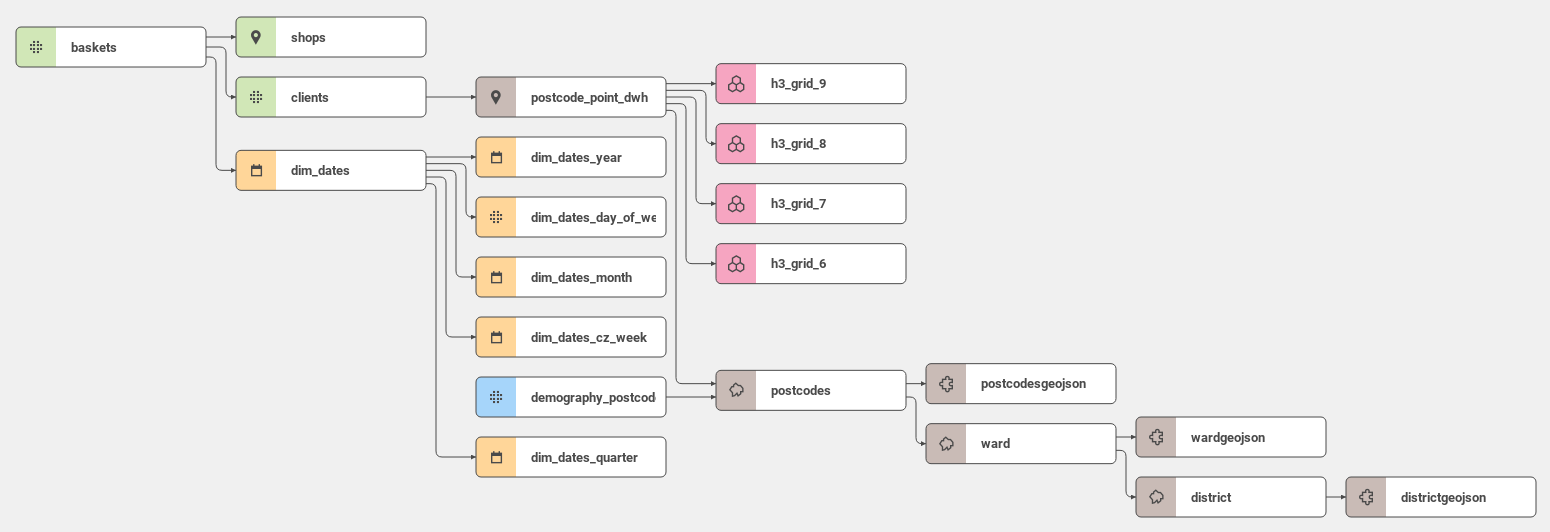
Native datasets in this project are baskets, shops and clients. The other datasets were imported from different data dimensions. The datasets in orange were imported from the can-dim-dates dimension. Brown datasets are from a UK administrative units dimension. The dataset demography_postcode comes from a UK demography dimension. The h3Grid datasets are pink.
Detail of a dataset in the data model
If you click on any dataset a detail will be displayed.
The detail of a dwh dataset contains 3 blocks - Overview, Properties and Data load history. Please note that Data load history is diplayed only to administrators of a project. It's also possible to see the Data preview, where you can check if your data have loaded properly, sort or filter by the value of any column.
The detail of a vt dataset contains only the Overview block. It is possible click the link to Mapbox to see a geometry preview.
dwh dataset detail | vt dataset detail | h3Grid dataset detail |
|
|  |
Dataset data preview
Data preview with applied filters to some shop_id, month and on_off_name dataset properties.
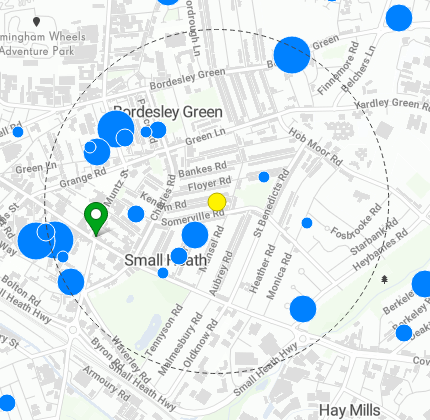
Tooltip shown on hover
For geometryPoint and geometryPolygon datasets, a tooltip is shown on hover. The content is defined in dataset.properties.
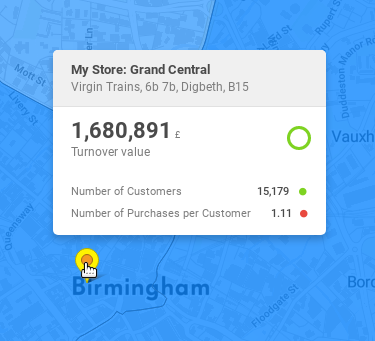
"My Store: Grand Central" is the featureTitle.
"Virgin Trains, 6b 7b, Digbeth, B15" is the featureSubtitle.
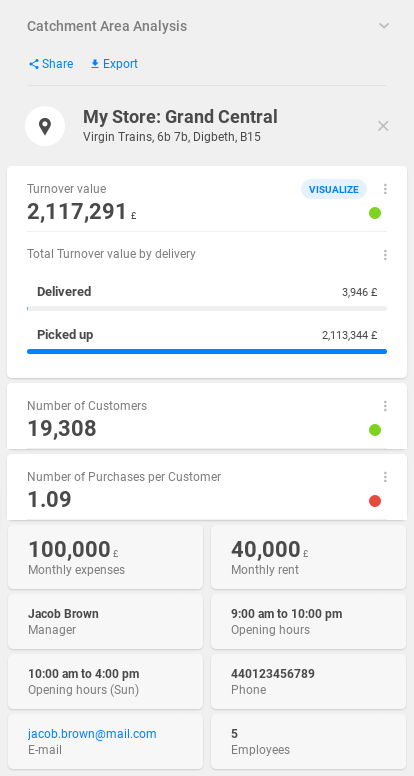
Dataset details
The content of dataset details is defined in dataset.properties.featureAttributes. The details are shown on the dashboard, right under the indicator list.
Feature accuracy
Hovering or clicking down on a feature with properties.featureAccuracy specified.