In the first tutorial, we visualized our customers' data in the map. We added a simple metric and a simple indicator which worked with one dataset.
...
| Name | Title | Data type |
|---|---|---|
transaction_id | Transaction ID | integer |
customer_id | Customer ID | integer |
store_id | Store ID | integer |
date | Date of the transaction | date |
amount | Transaction amount | decimal |
day_index | Week day index | integer |
day_name | Week day | string |
hour | Hour index | integer |
time_category | Time category | string |
channel | Channel (online/offline) | string |
...
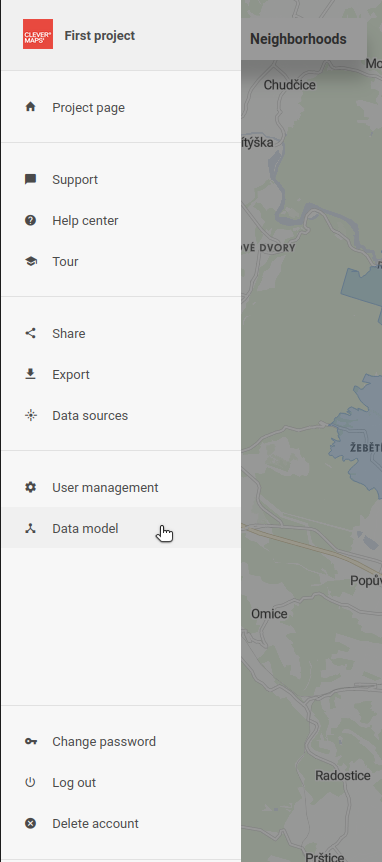
Each CleverMaps project is based around its data model. Visualization of the data model can be viewed:
- by hovering the Account icon on the bottom left of clicking three-dots icon next to project title on a Project page, and selecting Data model
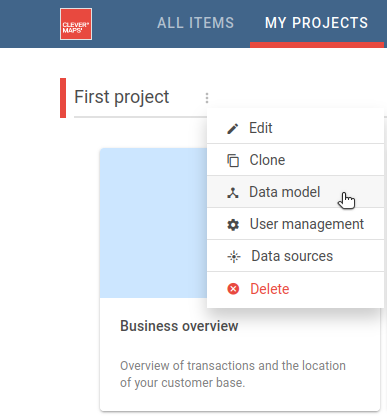
- by clicking on Menu in the top left and selecting Data model from the map
| Info |
|---|
Please note that the visualization of data model is available only to users with the Admin user role. |
...
- change
content.typetofunction_sum - change
content.type.content[0].valuetotransactions.amount
...
| Code Block | ||
|---|---|---|
| ||
{
    "id": "j2idsg8tq7icp62f",
    "name": "business_overview_dashboard",
    "type": "dashboard",
    "content": {
        "blockRows": [
            {
                "type": "indicator",
                "indicator": "/rest/projects/$projectId/md/indicators?name=customers_indicator",
                "indicatorDrill": "/rest/projects/$projectId/md/indicatorDrills?name=empty_indicator_drill",
                "layout": "primary"
            },
            {
                "type": "indicator",
                "indicator": "/rest/projects/$projectId/md/indicators?name=turnover_indicator",
                "indicatorDrill": "/rest/projects/$projectId/md/indicatorDrills?name=empty_indicator_drill",
                "layout": "primary"
            }
        ]
    },
    "accessInfo": {
        "createdAt": "2020-06-23T17:26:08Z",
        "createdBy": "/rest/accounts/00ubfu7fdyIoFKxXm0h7"
    },
    "links": [
        {
            "rel": "self",
            "href": "/rest/projects/k5t8mf2a80tay2ng/md/dashboards/j2idsg8tq7icp62f"
        }
    ]
}
|
Use pushProject to upload modified dashboard into the project.
Now, there's a new indicator on the dashboard, and you are able to see the turnover values aggregated to the customer addresses.
...