Datasets describe the data model of a project. Each dataset represents a database table. They also define the constraints and links between all other datasets in a project.
There are two three types of datasets:
dwh( ) type is a data warehouse service dataset type, it references a table in a relational dwh database, which may contain various kinds of data (e.g. orders, customers, administrative units...)
vt( ) type is a vector tile dataset type, it references a vector tile service, which serves vector tiles that are displayed over the base map (CleverMaps vector tiles are hosted on Mapbox)
h3Grid( ) type is a H3 grid dataset, it represents a grid visualization, where the geometries are generated on the fly by the application (see Tutorial 8 for more info, and H3 grid spatial index by Uber)
Datasets of dwh type also have a subtype, which defines the type of data they contain. There are five of them:
...
| Code Block | ||
|---|---|---|
| ||
{
    "name": "baskets",
    "type": "dataset",
    "title": "Baskets",
    "properties": {
        "featureTitle": {
            "type": "property",
            "value": "basket_id"
        }
    },
    "ref": {
        "type": "dwh",
        "subtype": "basic",
        "table": "baskets",
        "primaryKey": "basket_id",
        "categorizable": true,
        "fullTextIndex": false,
        "properties": [
            {
                "filterable": true,
                "name": "date_iso",
                "title": "Date ISO",
                "column": "date_iso",
                "type": "string"
            },
            {
            	"filterable": false,
                "name": "shop_id",
                "title": "Shop ID",
                "column": "shop_id",
                "type": "integer"
            },
            {
            	"filterable": false,
                "name": "client_id",
                "title": "Client ID",
                "column": "client_id",
                "type": "integer"
            },
            {
            	"filterable": true,
                "name": "amount",
                "title": "Purchase value",
                "column": "amount",
                "type": "decimal(16,2)"
            },
            {
            	"filterable": true,
                "name": "month",
                "title": "Month",
                "column": "month",
                "type": "integer"
            },
            {
            	"filterable": true,
                "name": "on_off_name",
                "title": "Channel",
                "column": "on_off_name",
                "type": "string"
            },
            {
            	"filterable": true,
                "name": "action_turnover",
                "title": "Action turnover",
                "column": "action_turnover",
                "type": "decimal(16,2)"
            },
            {
            	"filterable": true,
                "name": "courier",
                "title": "Delivery type",
                "column": "courier",
                "type": "string"
            },
            {
            	"filterable": false,
                "name": "value_cat",
                "title": "Item value category",
                "column": "value_cat",
                "type": "integer"
            },
            {
            	"filterable": true,
                "name": "value_name",
                "title": "Item value name",
                "column": "value_name",
                "type": "string"
            },
            {
            	"filterable": false,
                "name": "basket_id",
                "title": "Basket ID",
                "column": "basket_id",
                "type": "integer"
            }
        ]
    }
}
|
...
This dataset describes the geometries of UK districts. These geometries are served to the application and visualised as polygons on the map. This geometry is referenced in a dwh dataset district in the examples below.
| Code Block | ||
|---|---|---|
| ||
{
    "name": "districtgeojson",
    "type": "dataset",
    "title": "Vector tiles for UK district polygons",
    "ref": {
        "type": "vt",
        "urlTemplate": "https://a.tiles.mapbox.com/v4/cleveranalytics.dia058st/{z}/{x}/{y}.vector.pbf?access_token={token}",
        "zoom": {
            "min": 8,
            "optimal": 10,
            "max": 15
        }
    },
    "dataSources": [
        {
            "licenceHolder": "Office for National Statistics",
            "licenceHolderUrl": "https://www.ons.gov.uk/",
            "licenceUrl": "http://www.nationalarchives.gov.uk/doc/open-government-licence/version/3/"
        }
    ]
}
|
Additional syntax examples
...
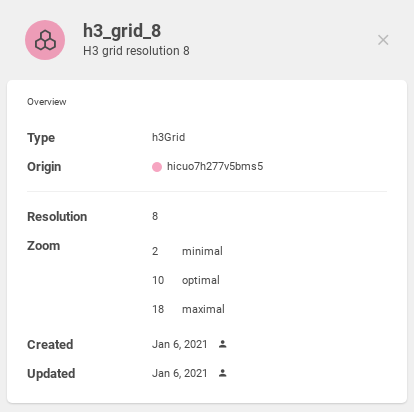
This dataset represents H3 grid visualization on resolution 8. It's very similar to vt dataset, apart from resolution you only need to define appropriate zoom. See Example to see how to link this dataset to a geometryPoint dwh dataset.
| Code Block | |||||
|---|---|---|---|---|---|
| |||||
{
    "name": "shopsh3_grid_8",
    "type": "dataset",
    "title": "ShopsH3 grid resolution 8",
    "propertiesref": {
        "featureTitletype": {
 "h3Grid",
          "typeresolution": "property"8,

           "valuezoom": "name"{
        },         "featureSubtitlemin": {2,
            "typeoptimal": "property"10,
            "valuemax": "address"18
        },
    }
}
|
Additional syntax examples
| Note |
|---|
Important - to properly understand datasets, please see the examples below. |
| Code Block | ||||
|---|---|---|---|---|
| ||||
{ "featureAttributesname": ["shops", "type": "dataset", "title": "Shops", { "properties": { "typefeatureTitle": "property",{ "valuetype": "manager_name"property", "value": "name" }, }, { "featureSubtitle": { "type": "property", "value": "opening_hoursaddress" }, }, "featureAttributes": [ { "type": "property", "value": "openingmanager_hours_sunname" }, { "type": "property", "value": "contactopening_phonehours" }, { "type": "property", "value": "contactopening_hours_mail",sun" }, "format": { { "type": "emailproperty", }"value": "contact_phone" }, { "type": "property", "value": "employeescontact_mail", }, "format": { { "type": "propertyemail", } "value": "monthly_expenses", }, "format": { { "type": "numberproperty", "fractionvalue": 0, "symbol": "£" }"employees" }, { "type": "property", "value": "monthly_rentexpenses", "format": { "type": "number", "fraction": 0, "symbol": "£" } }, ] { }, "ref": { "type": "dwhproperty", "subtype "value": "geometryPointmonthly_rent", "visualizations": [ "format": { { "type": "dotmapnumber", } "fraction": ]0, "table": "shops", "primaryKeysymbol": "shop_id£", "categorizable": true, } "fullTextIndex": true, "properties": [} ] }, "ref": { "type": "dwh", "filterablesubtype": false,"geometryPoint", "visualizations": [ { "nametype": "shop_id",dotmap" } "title": "Shop ID"], "table": "shops", "columnprimaryKey": "shop_id", "categorizable": true, "typefullTextIndex": "integer"true, "properties": [ }, { "filterable": truefalse, "name": "nameshop_id", "title": "NameShop ID", "column": "nameshop_id", "type": "stringinteger" }, { "filterable": falsetrue, "name": "addressname", "title": "AddressName", "column": "addressname", "type": "string" }, { "filterable": false, "name": "address"opening_hours", "title": "Opening hoursAddress", "column": "opening_hoursaddress", "type": "string" }, { "filterable": false, "name": "opening_hours_sun", "title": "Opening hours (Sun)", "column": "opening_hours_sun", "type": "string" }, { "filterable": truefalse, "name": "manageropening_hours_namesun", "title": "ManagerOpening hours (Sun)", "column": "manageropening_hours_namesun", "type": "string" }, { "filterable": true, "name": "partnermanager_name", "title": "PartnerManager", "column": "partnermanager_name", "type": "string" }, { "filterable": falsetrue, "name": "lat"partner", "title": "Partner", "column": "latpartner", "type": "latitudestring" }, { "filterable": false, "name": "lnglat", "column": "lnglat", "type": "longitudelatitude" }, { "filterable": false, "name": "contact_phonelng", "title": "Phone", "column": "contact_phonelng", "type": "stringlongitude" }, { "filterable": false, "name": "contact_mailphone", "title": "E-mailPhone", "column": "contact_mailphone", "type": "string" }, { "filterable": truefalse, "name": "employeescontact_mail", "title": "EmployeesE-mail", "column": "employeescontact_mail", "type": "integerstring" }, { "filterable": true, "name": "monthly_expensesemployees", "title": "Monthly expensesEmployees", "column": "monthly_expensesemployees", "type": "integer" }, { "filterable": true, "name": "monthly_rentexpenses", "title": "Monthly rentexpenses", "column": "monthly_rentexpenses", "type": "integer" } , ] } } |
This dwh dataset represents locations of stores. Each store has a location (lat and lon properties), and is visualised by a marker. So, in this case the "subtype" is "geometryPoint".
| Info |
|---|
In |
_
| Code Block | ||||
|---|---|---|---|---|
| ||||
{
    "name": "district",     "type": "dataset",     "titlefilterable": "Districts"true,
    "origin": "https://secure.clevermaps.io/rest/projects/mxl3pmyqc7kz04hl/md/datasets?name=district",     "properties": {         "featureTitlename": {
      "monthly_rent",
     "type": "property",             "valuetitle": "districtnameMonthly rent",
        },         "featureSubtitlecolumn": {
     "monthly_rent",
      "type": "property",             "valuetype": "upper_admin_nameinteger"
        }     },
    "ref": {   ]
    }
"type": "dwh",
    }
|
This dwh dataset represents locations of stores. Each store has a location (lat and lon properties), and is visualised by a marker. So, in this case the "subtype" is "geometryPoint".
| Info |
|---|
In |
_
| Code Block | ||||
|---|---|---|---|---|
| ||||
{ "subtypename": "geometryPolygondistrict", "type": "dataset", "geometrytitle": "districtgeojsonDistricts", "visualizationsorigin": ["https://secure.clevermaps.io/rest/projects/mxl3pmyqc7kz04hl/md/datasets?name=district", "properties": { { "featureTitle": { "type": "areasproperty", }"value": "districtname" ]}, "tablefeatureSubtitle": "district_dwh", { "primaryKeytype": "districtcodeproperty", "categorizable": false, "fullTextIndexvalue": true,"upper_admin_name" "properties":} [ }, "ref": { { "type": "dwh", "filterablesubtype": false, "geometryPolygon", "namegeometry": "districtcodedistrictgeojson", "titlevisualizations": "districtcode",[ "column": "districtcode", { "type": "stringareas" }, ], { "table": "district_dwh", "primaryKey": "districtcode", "categorizable": false, "fullTextIndex": true, "properties": [ { "filterable": truefalse, "name": "districtnamedistrictcode", "title": "districtnamedistrictcode", "column": "districtnamedistrictcode", "type": "string" }, { "filterable": falsetrue, "name": "y_mindistrictname", "title": "y_mindistrictname", "column": "y_mindistrictname", "type": "decimal(19,16)string" }, { "filterable": false, "name": "y_maxmin", "title": "y_maxmin", "column": "y_maxmin", "type": "decimal(19,16)" }, { "filterable": false, "name": "xy_minmax", "title": "xy_minmax", "column": "xy_minmax", "type": "decimal(19,16)" }, { "filterable": false, "name": "x_maxmin", "title": "x_maxmin", "column": "x_maxmin", "type": "decimal(19,16)" }, { "filterable": truefalse, "name": "upperx_admin_namemax", "title": "upperx_admin_namemax", "column": "upperx_admin_namemax", "type": "stringdecimal(19,16)" }, { ] }, "dataSourcesfilterable": [ true, "name": "upper_admin_name", { "licenceHoldertitle": "Office for National Statistics",upper_admin_name", "licenceHolderUrlcolumn": "https://www.ons.gov.uk/",upper_admin_name", "licenceUrltype": "http://www.nationalarchives.gov.uk/doc/open-government-licence/version/3/"string" } ] } |
This dataset represents dwh data of the districts of the United Kingdom. Districts have a geometry, so they can be visualised as polygons on the map. Thus, "subtype" is "geometryPolygon".
The dataset also contains information about its data sources. The source data for UK districts was provided by Office for National Statistics under the Open Government license. For more info, see the syntax below.
| Info |
|---|
Note the reference to a vt dataset named districtgeojson in ref.properties.geometry key. This dataset must exist in the project before we add the geometryPolygon one. ]
},
"dataSources": [
{
"licenceHolder": "Office for National Statistics",
"licenceHolderUrl": "https://www.ons.gov.uk/",
"licenceUrl": "http://www.nationalarchives.gov.uk/doc/open-government-licence/version/3/"
}
]
}
|
This dataset represents dwh data of the districts of the United Kingdom. Districts have a geometry, so they can be visualised as polygons on the map. Thus, "subtype" is "geometryPolygon".
The dataset also contains information about its data sources. The source data for UK districts was provided by Office for National Statistics under the Open Government license. For more info, see the syntax below.
| Info |
|---|
Note the reference to a |
_
| Code Block | ||||
|---|---|---|---|---|
| ||||
{
    "name": "pipelines",
    "type": "dataset",
    "title": "Gas pipelines",
    "properties": {
        "featureTitle": {
            "type": "property",
            "value": "type"
        }
    },
    "ref": {
        "type": "dwh",
        "subtype": "geometryLine",
        "geometry": "pipelines_geojson",
        "visualizations": [
            {
                "type": "line"
            }
        ],
        "table": "pipelines",
        "primaryKey": "id",
        "categorizable": true,
        "fullTextIndex": true,
        "properties": [
            {
                "filterable": false,
                "name": "id",
                "title": "ID",
                "column": "id",
                "type": "integer"
            },
            {
                "filterable": true,
                "name": "source",
                "title": "Source",
                "column": "source",
                "type": "string"
            },
            {
                "filterable": true,
                "name": "type",
                "title": "Type",
                "column": "type",
                "type": "string"
            },
            {
                "filterable": false,
                "name": "x_min",
                "title": "x_min",
                "column": "x_min",
                "type": "decimal(19,16)"
            },
            {
                "filterable": false,
                "name": "x_max",
                "title": "x_max",
                "column": "x_max",
                "type": "decimal(19,16)"
            },
            {
                "filterable": false,
                "name": "y_min",
                "title": "y_min",
                "column": "y_min",
                "type": "decimal(19,16)"
            },
            {
                "filterable": false,
                "name": "y_max",
                "title": "y_max",
                "column": "y_max",
                "type": "decimal(19,16)"
            }
        ]
    }
}
|
This dataset represents a gas pipeline network. The pipelines are visualised by lines, so "subtype" is "geometryLine". However, remember that the actual geometries are described by the pipelines_geojson vt dataset.
_
| Code Block | ||||
|---|---|---|---|---|
| ||||
{
    "name": "pipelinesdim_dates",
    "type": "dataset",
    "title": "Gas pipelinesdates",
    "properties": {
        "featureTitle": {
            "type": "property",
            "value "value": "date_en"
        }
    },
    "ref": {
        "type": "typedwh",
        }
"subtype": "date",
   },     "reftable": {"dim_dates",
        "typeprimaryKey": "dwhdate_iso",
        "subtypecategorizable": "geometryLine"false,
        "geometryfullTextIndex": "pipelines_geojson"false,
        "visualizationsproperties": [
            {
                "typefilterable": "line" false,
                }
"name": "date_iso",
       ],         "tabletitle": "pipelinesdate_iso",
                "primaryKeycolumn": "iddate_iso",
        "categorizable": true,       "type":  "fullTextIndexdate":
  true,         "properties": [ },
            {
                "filterable": false,
                "name": "iddate_kat",
                "title": "IDdate_kat",
                "column": "iddate_kat",
                "type": "integer"
            },
            {
                "filterable": truefalse,
                "name": "sourcedate_cz",
                "title": "Sourcedate_cz",
                "column": "sourcedate_cz",
                "type": "string"
            },
            {
                "filterable": truefalse,
                "name": "typedate_en",
                "title": "Typedate_en",
                "column": "typedate_en",
                "type": "string"
            },
            {
                "filterable": false,
                "name": "xday_of_minmonth",
                "title": "xday_of_minmonth",
                "column": "xday_of_minmonth",
                "type": "decimal(19,16)integer"
            },
            {
                "filterable": false,
                "name": "xday_of_maxquarter",
                "title": "xday_of_maxquarter",
                "column": "xday_of_maxquarter",
                "type": "decimal(19,16)integer"
            },
            {
                "filterable": false,
                "name": "yday_of_minyear",
                "title": "yday_of_minyear",
                "column": "yday_of_minyear",
                "type": "decimal(19,16)integer"
            },
            {
            {     "filterable": false,
                "name": "day_of_week_id",
                 "filterabletitle": false"day_of_week_id",
                "namecolumn": "y_maxday_of_week_id",
                "titletype": "y_maxinteger",
                "columnforeignKey": "y_max"dim_dates_day_of_week"
            },
            {
   "type": "decimal(19,16)"             }"filterable": false,
] } } |
This dataset represents a gas pipeline network. The pipelines are visualised by lines, so "subtype" is "geometryLine". However, remember that the actual geometries are described by the pipelines_geojson vt dataset.
_
| Code Block | ||||
|---|---|---|---|---|
| ||||
{"name": "week_id", "nametitle": "dimweek_datesid", "type "column": "datasetweek_id", "title "type": "datesinteger", "propertiesforeignKey": {"dim_dates_week" }, "featureTitle": { "typefilterable": "property"false, "valuename": "datemonth_enid", } },"title": "month_id", "ref": { "typecolumn": "dwhmonth_id", "subtypetype": "dateinteger", "table": "dim_dates", "primaryKeyforeignKey": "datedim_dates_isomonth", "categorizable": false, }, "fullTextIndex": false, { "properties": [ {"filterable": false, "filterablename": false"quarter_id", "nametitle": "datequarter_isoid", "titlecolumn": "datequarter_isoid", "columntype": "date_isointeger", "typeforeignKey": "datedim_dates_quarter" }, { "filterable": false, "name": "dateyear_katid", "title": "dateyear_katid", "column": "dateyear_katid", "type": "integer", "integer" "foreignKey": "dim_dates_year" }, ] { } } |
This is an example of the date subtype dataset. This subtype is almost exclusively used in the can-dim-dates dimension, used for date management and filtering in a project.
This subtype also enforces the presence of the featureTitle property. The property selected as a featureTitle defines what date will be show in the date picker, or the time series indicator drill block. This is useful in cases when you want to use the date names in different language. The can-dim-dates dimension currently offers either English (date_en) or Czech (date_cz).
_
| Code Block | ||||
|---|---|---|---|---|
| ||||
{ "filterablename": false"baskets", "type": "dataset", "nametitle": "date_czBaskets", "properties": { "titlefeatureTitle": "date_cz", { "columntype": "date_czproperty", "typevalue": "stringbasket_id" } }, { "ref": { "filterabletype": false"dwh", "name"subtype": "date_enbasic", "titletable": "date_enbaskets", "column"primaryKey": "datebasket_enid",, "categorizable": true, "typefullTextIndex": "string"false, "properties": [ }, { "filterable": falsetrue, "name": "daydate_of_monthiso", "title": "day_of_monthDate ISO", "column": "daydate_of_monthiso", "type": "integerstring" }, { "filterable": false, "name": "dayshop_of_quarterid", "title": "day_of_quarterShop ID", "column": "dayshop_of_quarterid", "type": "integer" }, { "filterable": false, "name": "dayclient_of_yearid", "title": "day_of_yearClient ID", "column": "dayclient_of_yearid", "type": "integer" }, { "filterable": falsetrue, "name": "day_of_week_id", "title": "day_of_week_id"amount", "columntitle": "day_of_week_idPurchase value", "typecolumn": "integeramount", "foreignKeytype": "dim_dates_day_of_weekdecimal(16,2)" }, { "filterable": falsetrue, "name": "week_idmonth", "title": "week_idMonth", "column": "week_idmonth", "type": "integer", }, "foreignKey": "dim_dates_week" { }, "filterable": true, { "filterablename": false"on_off_name", "nametitle": "month_idChannel", "titlecolumn": "monthon_off_idname", "columntype": "month_idstring", "typedisplayOptions": "integer",{ "foreignKey": "dim_dates_month" "valueOptions": [ }, { { "filterable": false, "namevalue": "quarter_idOnline", "title": "quarter_id", "columncolor": "quarter_idgreen", "type": "integer", }, "foreignKey": "dim_dates_quarter" }, { { "filterablevalue": false"Offline", "name "color": "year_id",red" } "title": "year_id", ] "column": "year_id", } "type": "integer", }, "foreignKey": "dim_dates_year" { } "filterable": true, ] } } |
This is an example of the date subtype dataset. This subtype is almost exclusively used in the can-dim-dates dimension, used for date management and filtering in a project.
This subtype also enforces the presence of the featureTitle property. The property selected as a featureTitle defines what date will be show in the date picker, or the time series indicator drill block. This is useful in cases when you want to use the date names in different language. The can-dim-dates dimension currently offers either English (date_en) or Czech (date_cz).
_
| Code Block | ||||
|---|---|---|---|---|
| ||||
{ "name": "basketsaction_turnover", "type": "dataset", "title": "BasketsAction turnover", "properties": { "featureTitlecolumn": { "action_turnover", "type": "property",decimal(16,2)" }, "value": "basket_id" { } }, "reffilterable": { true, "typename": "dwhcourier", "subtypetitle": "basicDelivery type", "table "column": "basketscourier", "primaryKey "type": "basket_id",string", "categorizabledisplayOptions": true,{ "fullTextIndex": false, "propertiesvalueOptions": [ { { "filterable": true, "namevalue": "date_isoPicked up", "titlecolor": "blue"Date ISO", "column": "date_iso", }, "type": "string" { }, { "filterablevalue": false,"Delivered", "namecolor": "shop_id",pink" "title": "Shop ID",} "column": "shop_id", ] "type": "integer" } }, { "filterable": false, "name": "clientvalue_idcat", "title": "ClientItem value IDcategory", "column": "clientvalue_idcat", "type": "integer", }, "displayOptions": { { "filterablevalueOptions": true,[ "name": "amount", { "title": "Purchase value", "columnvalue": "amount",Up to £ 20", "type": "decimal(16,2)" }, "color": "blue" { "filterable": true}, "name": "month", { "title": "Month", "columnvalue": "month",£ 20 - 50", "type": "integer" }, "color": "purple" { "filterable": true}, "name": "on_off_name", { "title": "Channel", "columnvalue": "on_off_name", £ 50 - 100", "type": "string", "color": "red" "displayOptions": { "valueOptions": [ }, { "value": "Online£ 100 - 250", "color": "greenorange" }, { "value": "OfflineMore than £ 250", "color": "redgreen" } ] } }, { "filterable": true, "name": "actionvalue_turnovername", "title": "ActionItem value turnovername", "column": "actionvalue_turnovername", "type": "decimal(16,2)string" }, { "filterable": truefalse, "name": "courierbasket_id", "title": "Delivery typeBasket ID", "column": "basket_id", "columntype": "courierinteger", } "type": "string", ] } } |
This dataset has the displayOptions.valueOptions object set on some properties. These are the properties that are also used in a categories block in any linked indicator drill. This gives you the ability to use the qualitative visualization (more info in Tutorial 5: Drilling down on the data).
For example, the baskets.on_off_name property has two possible values: "Online" and "Offline". So the objects with prevailing "Online" value will become green, and objects with prevailing "Offline" will become red.
| Code Block | ||||
|---|---|---|---|---|
| ||||
{ "displayOptionsname": {"buildings", "type": "dataset", "title": "Customer address ID", "valueOptionsproperties": [{ { "featureTitle": { "valuetype": "Picked upfunction", "colorvalue": "blueconcat", "content": [ }, { { "type": "text", "value": "DeliveredID: ", }, "color": "pink" { } "type": "property", ] "value": "id" } } }, ] { }, "filterablefeatureSubtitle": false, { "nametype": "value_catproperty", "titlevalue": "ward"Item value category", } }, "columnref": "value_cat", { "type": "integerdwh", "subtype": "geometryPoint", "displayOptionsh3Geometries": {[ "h3_grid_6", "valueOptions": [ "h3_grid_7", "h3_grid_8", { "h3_grid_9" ], "value"visualizations": "Up to £ 20",[ { "colortype": "blueheatmap" }, }, { "type": "dotmap" { } ], "valuetable": "£ 20 - 50buildings", "primaryKey": "id", "categorizable": true, "colorfullTextIndex": "purple"true, "properties": [ { }, "name": "id", { "title": "id", "valuecolumn": "£ 50 - 100id", "color"type": "redinteger", "filterable": false }, }, { { "name": "lat", "valuecolumn": "£ 100 - 250","lat", "type": "latitude", "colorfilterable": "orange"true }, }, { "name": "lng", { "column": "lng", "valuetype": "More than £ 250longitude", "filterable": true "color": "green" }, { } "name": "ward", ] "title": "ward", } "column": "ward", }, "type": "string", { "filterable": true,false }, "name": "value_name", { "titlename": "Item value name", "columntitle": "value_name", "typecolumn": "stringname" , }, "type": "string", { "filterable": false, } "name": "basket_id", ] }, "dataSources": [ "title": "Basket ID", { "columnlicenceHolder": "basket_id© OpenStreetMap", "typelicenceHolderUrl": "integer"https://www.openstreetmap.org/", }"licenceUrl": "https://www.openstreetmap.org/copyright/en" ]} }] } |
This dataset has the displayOptions.valueOptions object set on some properties. These are the properties that are also used in a categories block in any linked indicator drill. This gives you the ability to use the qualitative visualization (more info in Tutorial 5: Drilling down on the data).For example, the baskets.on_off_name property has two possible values: "Online" and "Offline". So the objects with prevailing "Online" value will become green, and objects with prevailing "Offline" will become redis a simple dwh geometryPoint dataset which contains addresses with latitude and longitude. To visualize it using H3 grid, simply add some h3Grid datasets and specify them in the ref.h3Geometries array.
Notice the concat function in featureTitle. This function allows you to concat multiple properties and text to be displayed in the dataset's features tooltip and headers.
Key description
properties
...
| Key | Type | Optionality | Description | Constraints | ||||||||
|---|---|---|---|---|---|---|---|---|---|---|---|---|
type | string |
| type identifier, always dwh | [dwh] | ||||||||
| string |
|
| [basic, geometryPoint, geometryPolygon, geometryLine, date] | ||||||||
geometry | string |
| geometry reference to a vector tile dataset required only for | {datasetName} | ||||||||
h3Geometries | array |
| array of references to enables the grid visualization | |||||||||
visualizations | array |
| array of objects specifying the allowed visualizations of the dataset required only for | |||||||||
zoom | object |
| map zoom object | |||||||||
table | string |
| name of the actual it's derived from the name of the dataset, and _X postfix is added for each full load, where X is the number of the load | (a-z0-9_-) | ||||||||
primaryKey | string |
| primary key of the table - must be one of the dataset properties should be unique | {datasetProperty} | ||||||||
categorizable | boolean |
| indicates if the dataset is capable of being categorized in the Filters tool ( default = should be | [true, false] | ||||||||
fullTextIndex | string |
| indicates if the dataset's data will be indexed for full text search in Search tool ( default = | [true, false] | ||||||||
properties | array |
| array of dataset property order must be identical to the order of the data columns size must be at least 1 |
...
This is the visualization of the data model from the Retail Solution Demo project.

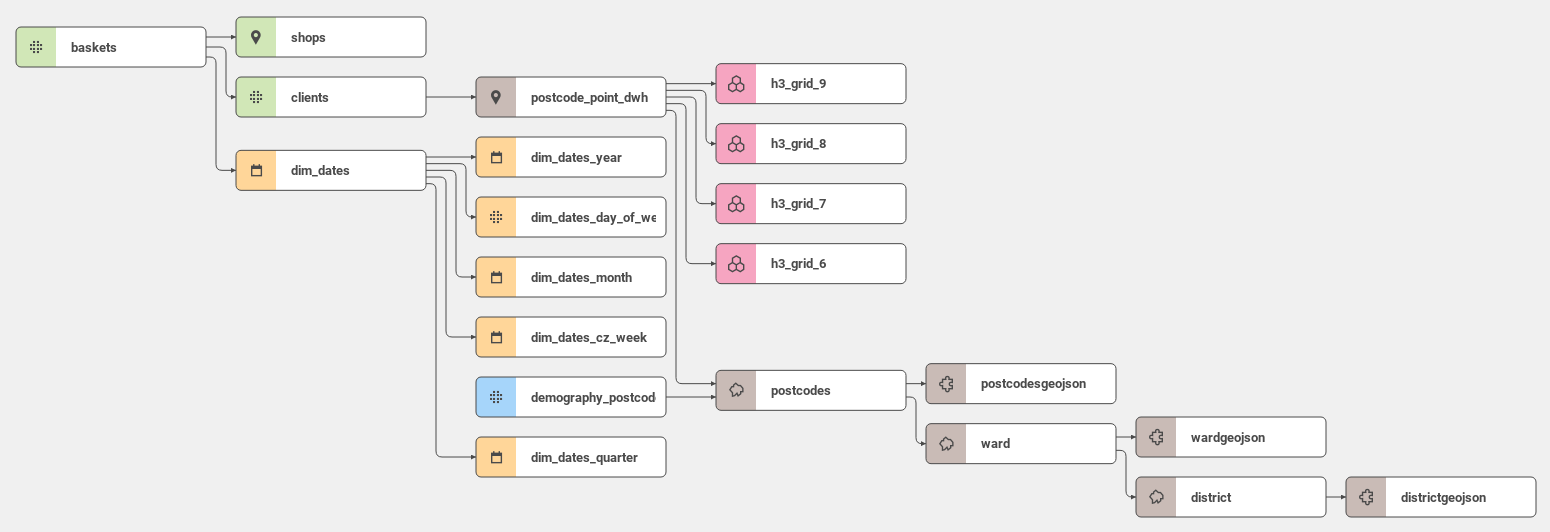
Native datasets in this project are baskets, shops and clients. The other datasets were imported from different data dimensions. The datasets in orange were imported from the can-dim-dates dimension. Brown datasets are from a UK administrative units dimension. The dataset demography_postcode comes from a UK demography dimension. The h3Grid datasets are pink.
Detail of a dataset in the data model
...
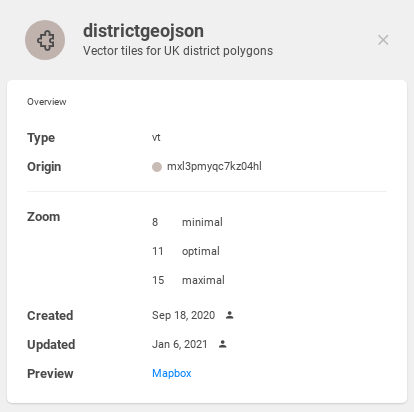
The detail of a vt dataset contains only the Overview block. It is possible click the link to Mapbox to see a geometry preview.
dwh dataset detail | vt dataset detail | h3Grid dataset detail |
|
|  |
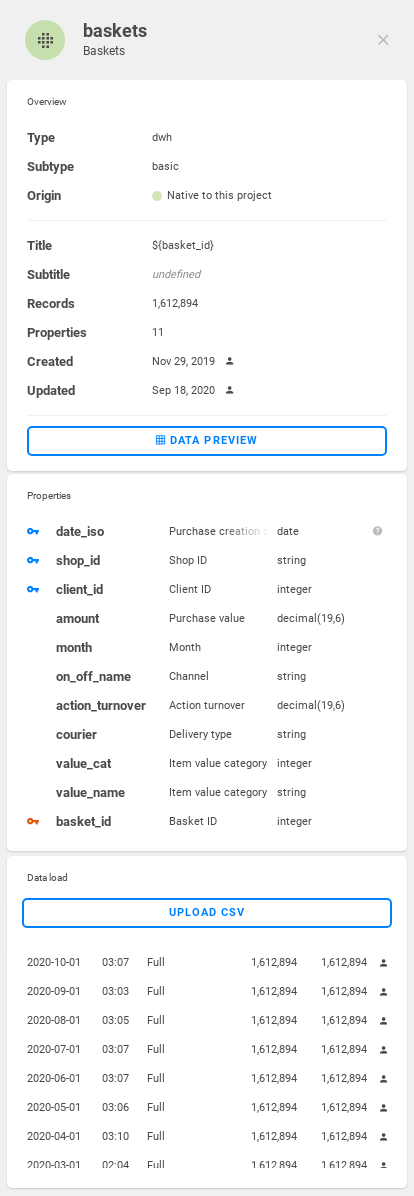
Dataset data preview
Data preview with applied filters to some shop_id, month and on_off_name dataset properties.
...
For geometryPoint and geometryPolygon datasets, a tooltip is shown on hover. The content is defined in dataset.properties.
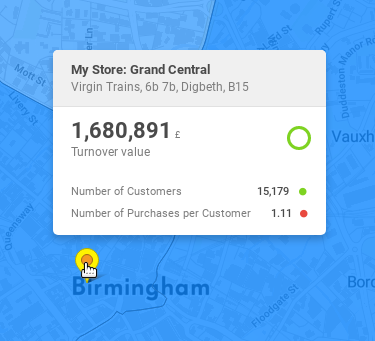
"My Store: Grand Central" is the featureTitle.
...