This tutorial will walk you through the process of creating a new project, writing basic project metadata and loading your data into the project.
Chapter summary
- Creating a new project
- Creating a dashboard and a view
- Creating a dataset and uploading the data
- Defining a metric and an indicator
- Conclusion
What you'll create
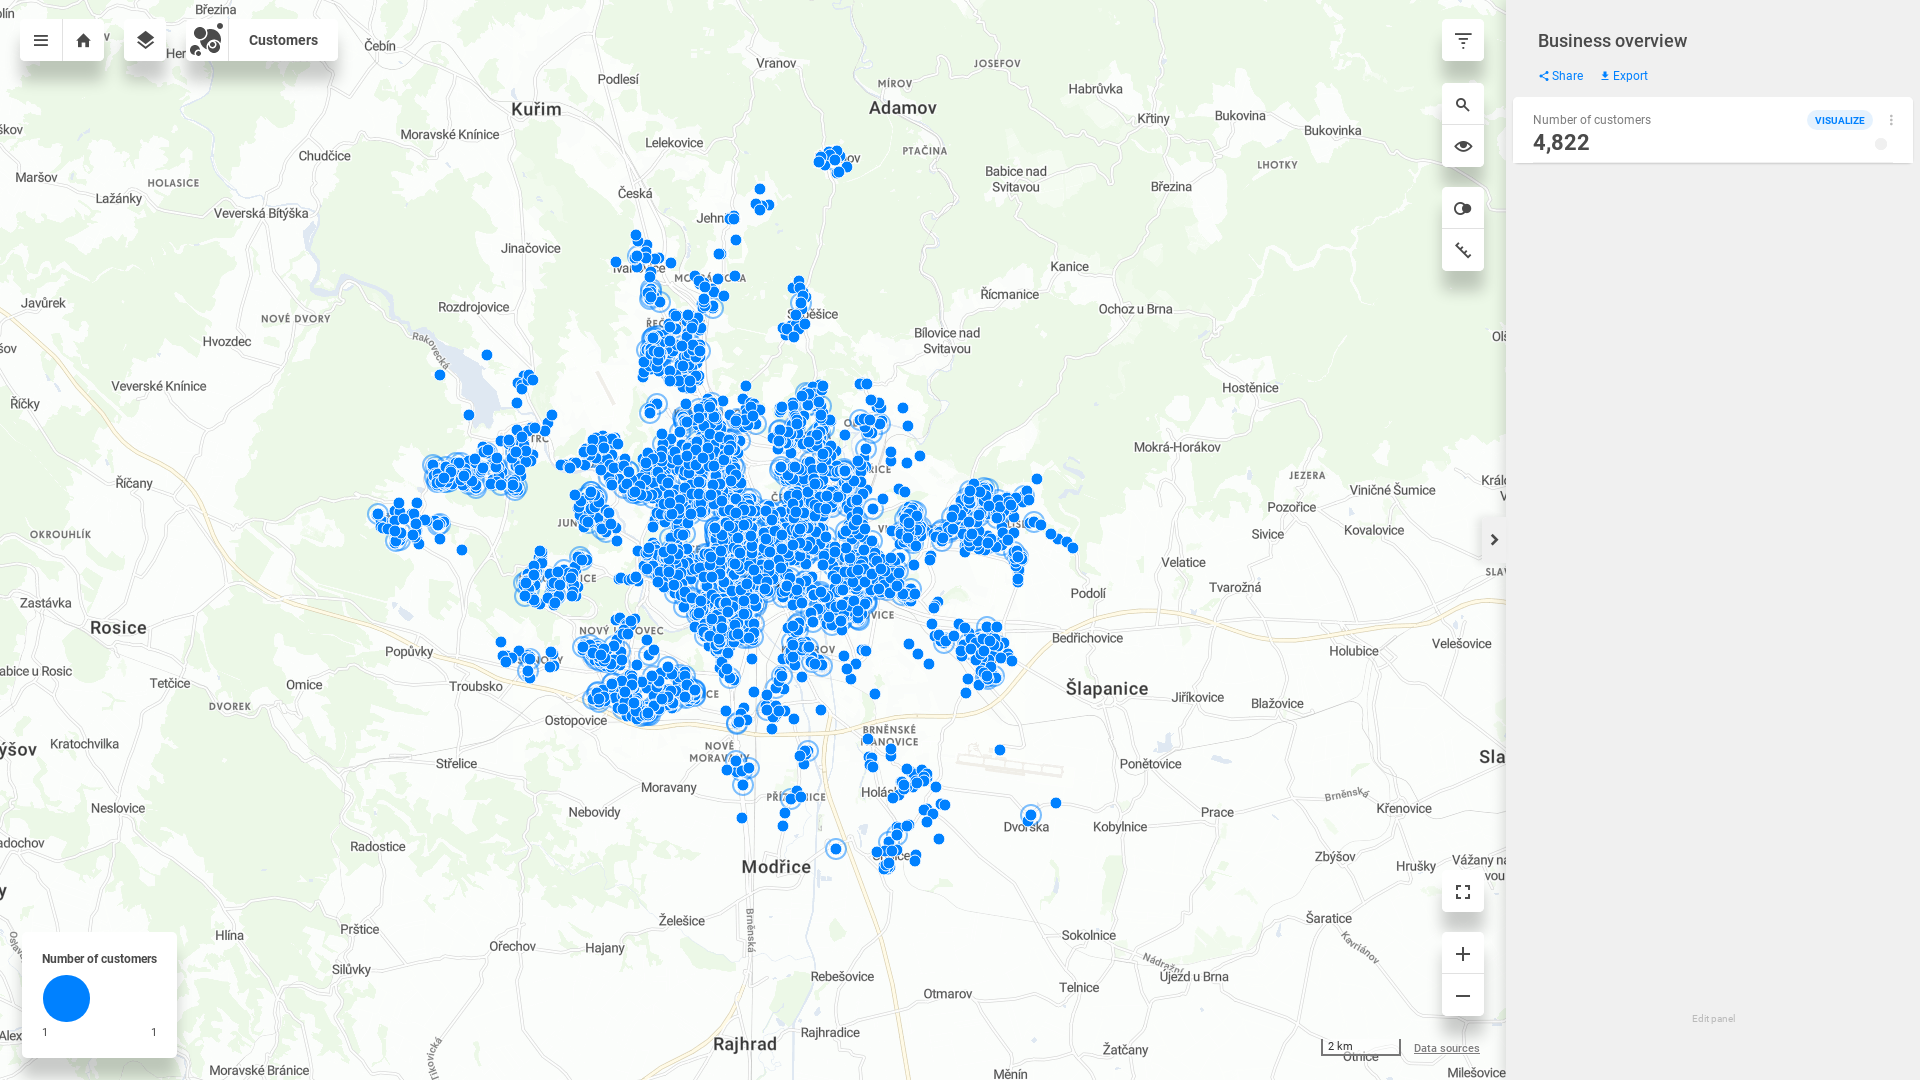
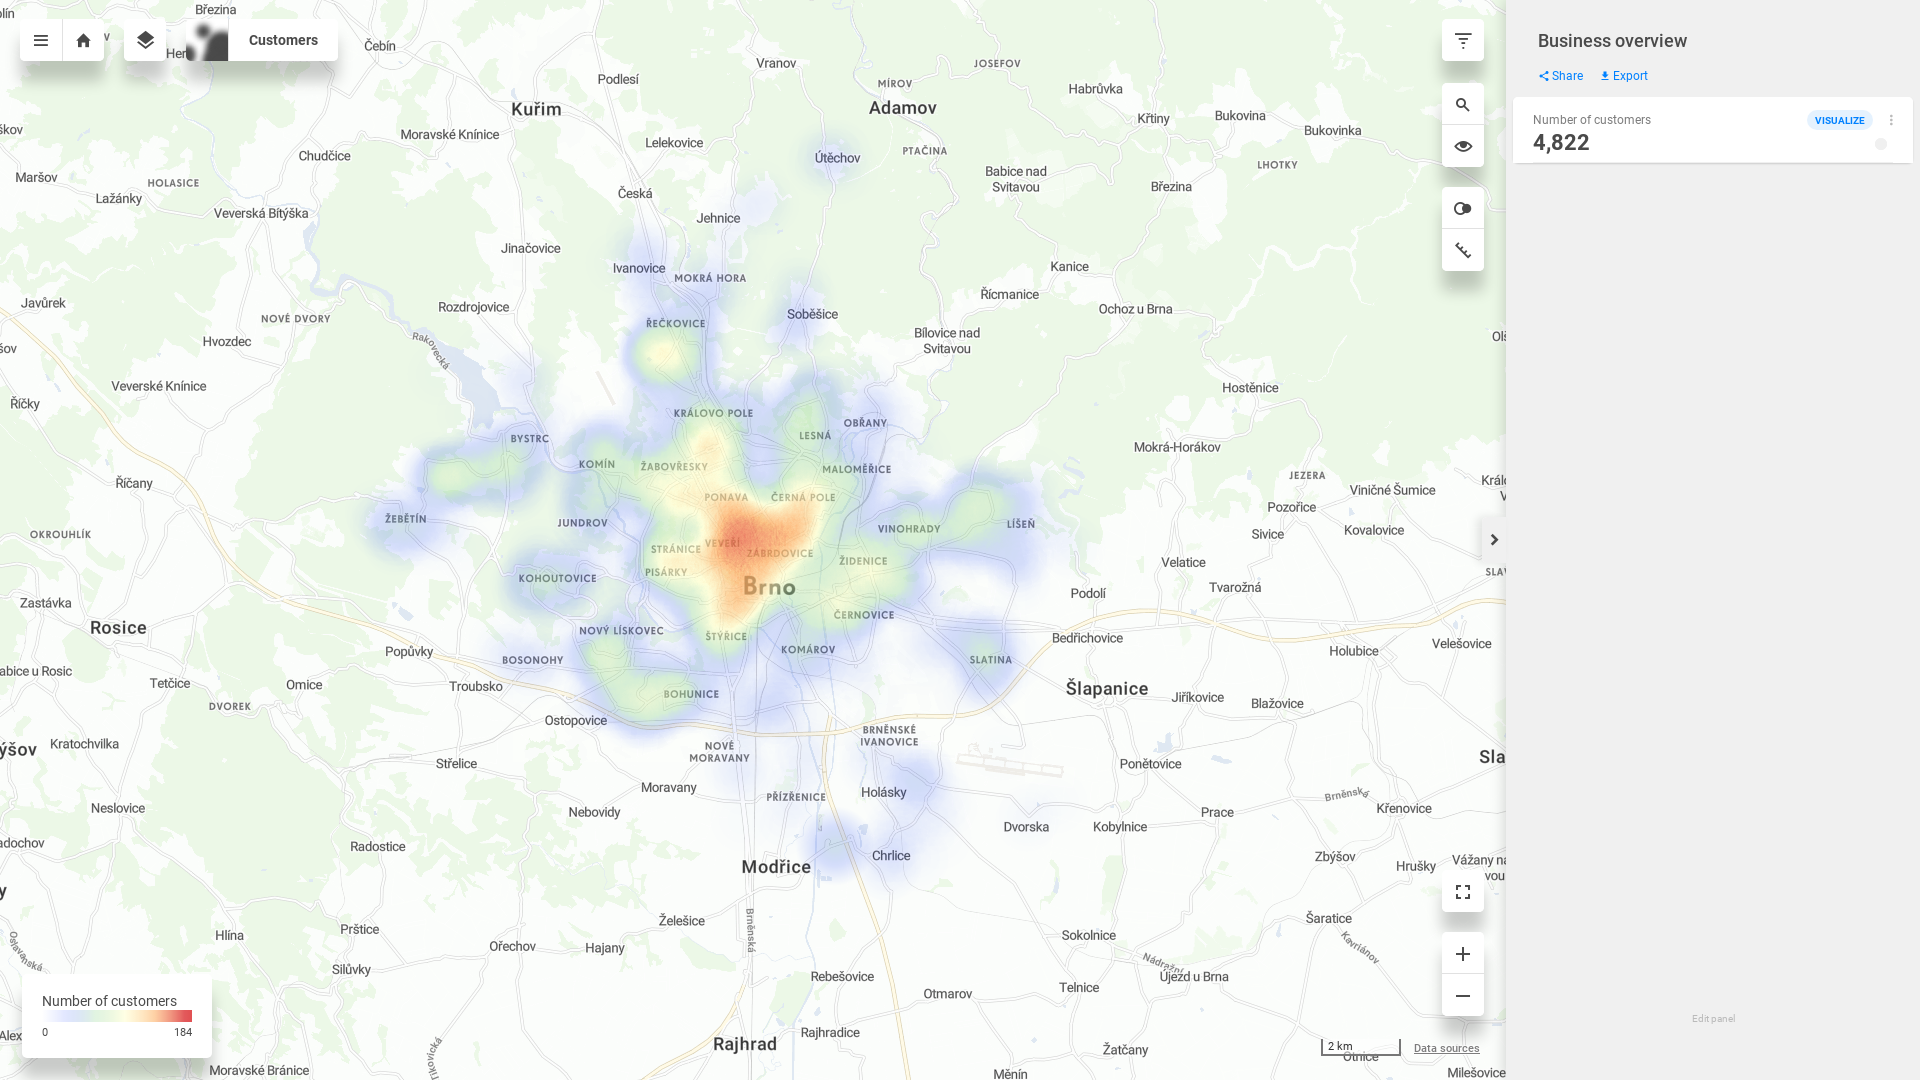
A simple CleverMaps project visualizing your clients' adresses on the map. We'll do that using 2 visualizations - dotmap, and heatmap.
...
...
...
...
You are able to complete this tutorial if:
- you have a CleverMaps account
- you have downloaded CleverMaps Shell and have successfully run it
| Note |
|---|
If you are not registered in the CleverMaps platform yet, you can do it on the web page. The instructions on how to download and install CleverMaps Shell can be found here. Registration to CleverMaps using social login (Facebook, Google) will not provide you the credentials that you use to log in to Shell. To be able to create your own CleverMaps projects, please register using an email address. |
| Info | ||||||||
|---|---|---|---|---|---|---|---|---|
| ||||||||
| Panel | ||||||||
| ||||||||
The content you are trying to reach has been moved here: https://docs.clevermaps.io/docs/tutorial-1-creating-a-project-and-visualizing-yourWe are proud to announce that we have launched a new documentation. Please update your saved links and bookmarks to follow a new address docs.clevermaps.io. |