In the first tutorial, we visualized our customers' data in the map. We added a simple metric and a simple indicator which worked with one dataset.
...
| Name | Title | Data type |
|---|---|---|
transaction_id | Transaction ID | integer |
customer_id | Customer ID | integer |
store_id | Store ID | integer |
date | Date of the transaction | date |
amount | Transaction amount | decimal |
day_index | Week day index | integer |
day_name | Week day | string |
hour | Hour index | integer |
time_category | Time category | string |
channel | Channel (online/offline) | string |
...
| Code Block | ||
|---|---|---|
| ||
tomas.schmidl@secure.clevermaps.io/project:chfbm77pn7klol8sk5t8mf2a80tay2ng/dump:2020-06-23_17-48-00$$ copyMetadata --objectName customers_metric --newName turnover_metric Object turnover_metric.json successfully created as a copy of object customers_metric.json tomas.schmidl@secure.clevermaps.io/project:chfbm77pn7klol8sk5t8mf2a80tay2ng/dump:2020-06-23_17-48-00$$ copyMetadata --objectName customers_indicator --newName turnover_indicator Object turnover_indicator.json successfully created as a copy of object customers_indicator.json |
...
| Code Block | ||||
|---|---|---|---|---|
| ||||
tomas.schmidl@secure.clevermaps.io/project:k5t8mf2a80tay2ng/dump:2020-06-23_17-48-00$$ importProject --project q1zdp9d0ao78rdv5 --server --datasets Validating DWH model/data integrity of project q1zdp9d0ao78rdv5... OK Importing project q1zdp9d0ao78rdv5 from server https://secure.clevermaps.io... |
Here, we omit a significant amount of the import command output for the sake of readability. This command wraps a number of other commands, whose output might not be that relevant to you. What is relevant is the result:
| Code Block | ||||
|---|---|---|---|---|
| ||||
Import finished! Source project: q1zdp9d0ao78rdv5 (can-dim-adm-units-cz-en) Source server: https://secure.clevermaps.io Destination project: project:k5t8mf2a80tay2ng (First project) Destination server: https://secure.clevermaps.io Imported datasets: 1621 Imported metadata objects: 0 Imported CSV files: 811 To view detailed imported content, use status command. Now you can make changes, or import another project. When you're done, use addMetadata command to add the metadata to the project. To push the data to the project, use pushProject command. |
...
Then use addMetadata and pushProject to upload it into your project. Let's have another look at the data model. You can see the dimension datasets with pink label.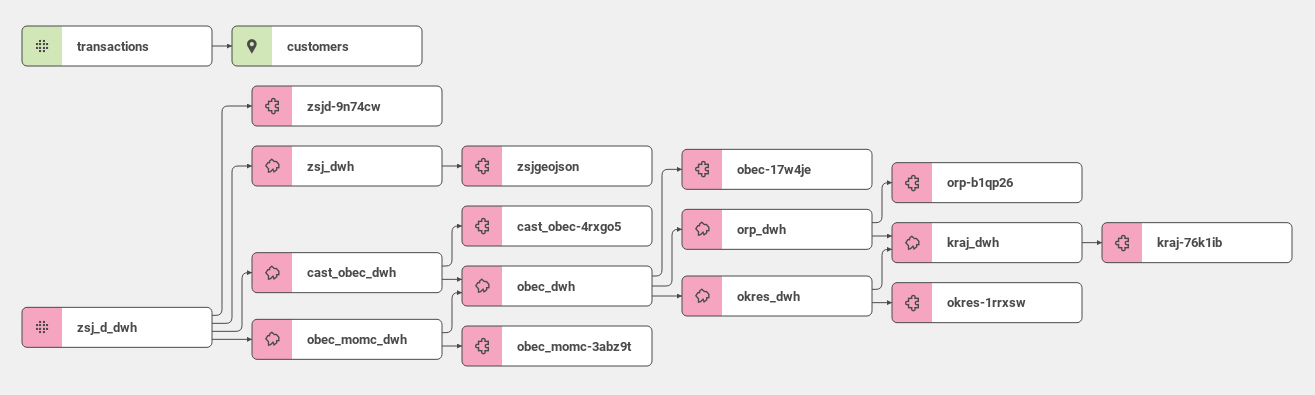
We just have to connect the customers dataset to the zsj_d_dwh dataset (Neighborhoods), which is the smallest administrative unit.
...
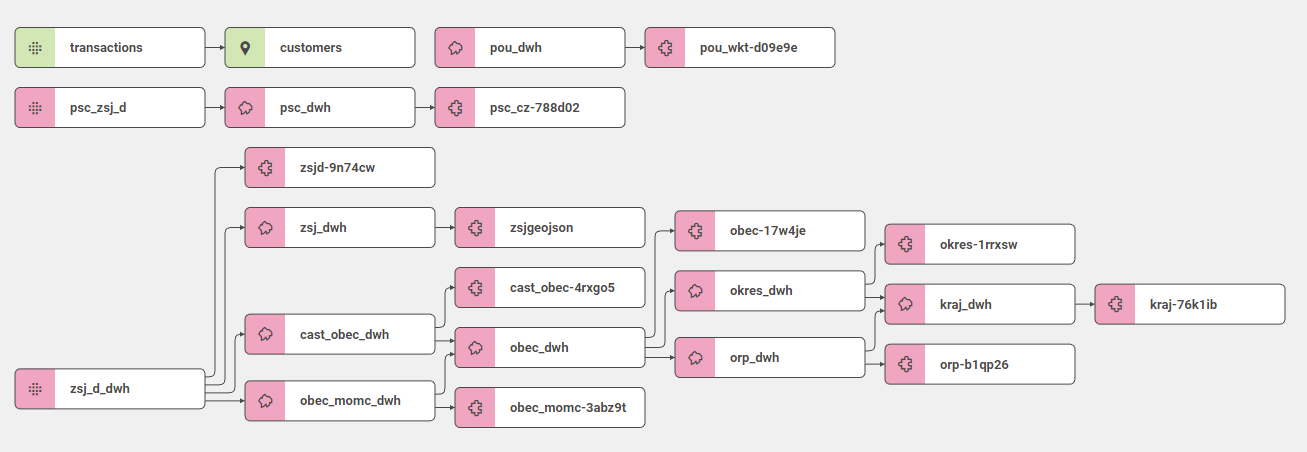
Use pushProject to push the changes. The data model should now look like this:
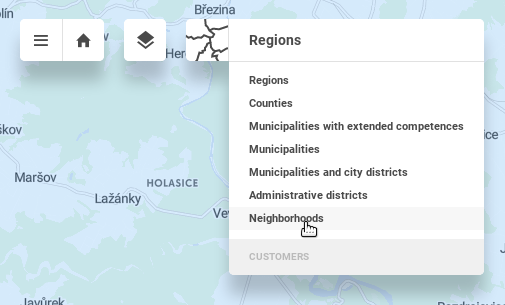
Open the Business overview view and see that the granularity has changed. Administrative units usually have multiple levels. By default we see the biggest level - Regions. Change the granularity to Neighborhoods in the granularity drop down menu in the upper left corner.
Visualize the Turnover value indicator to see the turnover aggregated to the Neighborhoods.
...