Marker selector groups different types of markers and assigns them to a dataset.
These groups exist, because often there can be different types of points in the map - different store types, warehouses, ATMs etc., each of them represented by a different dataset.
Syntax
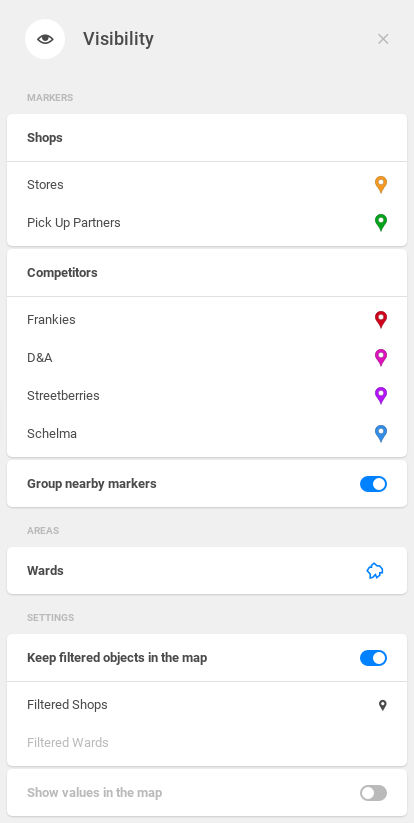
This is the marker selector that can be found in the Retail Solution Demo's Catchment Area Analysis and Customer Intelligence views.
This marker selector groups the company's own shops, and the partner shops.
{
    "name": "shops_marker_selector",
    "type": "markerSelector",
    "content": {
        "categories": [
            {
                "dataset": "/rest/projects/$projectId/md/datasets?name=shops",
                "markers": [
                    {
                        "marker": "/rest/projects/$projectId/md/markers?name=shops_marker",
                        "visible": true,
						"itemId": "8ac314a472a91c42bfbeac9cf90a30aa"
                    },
                    {
                        "marker": "/rest/projects/$projectId/md/markers?name=partners_marker",
                        "visible": true,
						"itemId": "95d3557834d051bc932882e8b7e4a7b0"
                    }
                ],
				"itemId": "569c103056dc6ca99d6f9dcec7279b48"
            },
            {
                "dataset": "/rest/projects/$projectId/md/datasets?name=competitors",
                "markers": [
                    {
                        "marker": "/rest/projects/$projectId/md/markers?name=competitor_frankies_marker",
                        "visible": false,
                        "addOnExpand": true,
						"itemId": "d8c7644858a40fb7ac90d15d685cffe1"
                    },
                    {
                        "marker": "/rest/projects/$projectId/md/markers?name=competitor_da_marker",
                        "visible": false,
                        "addOnExpand": true,
						"itemId": "8d053723cb9372574ceeae9bd0c360ba"
                    },
                    {
                        "marker": "/rest/projects/$projectId/md/markers?name=competitor_streetberries_marker",
                        "visible": false,
                        "addOnExpand": true,
						"itemId": "8ac314a472a91c42bfbeac9cf90a30aa"
                    },
                    {
                        "marker": "/rest/projects/$projectId/md/markers?name=competitor_schelma_marker",
                        "visible": false,
                        "addOnExpand": true,
						"itemId": "8d73221febc274d52f4367c3878506e0"
                    }
                ],
				"itemId": "08a28d47c1b25b25b69ba304bf286257"
            }
        ]
    }
}
Additional syntax examples
Marker selectors can also be used in a view where no markers are present. This is a simple example of marker selector, which only takes care of granularity visibility, and filtering objects.
We set the hideGranularity property to false, because we want to see the granularity when we enter the view. However, it doesn't have to be like this in all cases. We've also set that granularity objects (areas, lines) and markers will be visible in the map, even after they're filtered out.
_
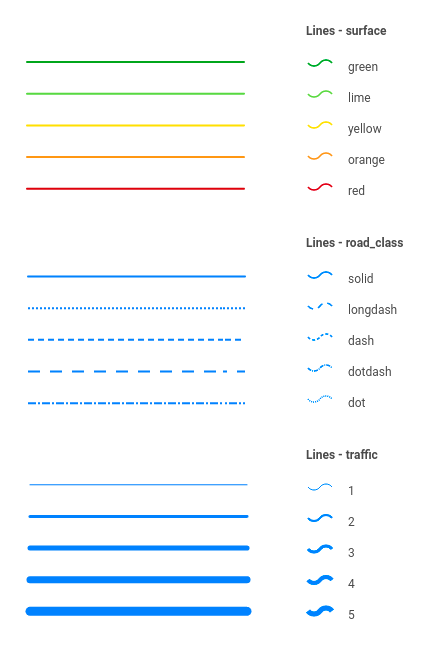
Another special use case marker selectors is with granularityCategories. This object can be used when setting up advanced lines visualization.
We have a dataset called roads, which contains 15 lines = roads. This dataset has (among others) these three properties: surface, road_class and traffic. We'll demonstrate the advanced line visualization on these properties.
Each category is linked to the dataset, specified by the property name, and type of the styleType.
The dataset properties have then these displayOptions, which contain the values from the data (value property):
And this is the outcome of the visualization. Also note that these 3 styles can be combined together.
Key description
content
| Key | Type | Optionality | Description | Constraints |
|---|---|---|---|---|
categories | array | OPTIONAL | array of marker categories either | size => 1 |
granularityCategories | array | OPTIONAL | array of granularity categories either | size => 1 |
hideGranularity | boolean | OPTIONAL | specifies if the granularity should be visible or not | [true, false] |
keepFiltered | object | OPTIONAL | specifies the "Keep filtered objects in the map" setting | |
showIndicatorValuesOnMap | boolean | OPTIONAL | specifies if indicator value for each area/grid should be displayed | [true, false] |
| clusterMarkers | boolean | OPTIONAL | specifies if marker clustering will be enabled or disabled | [true, false] |
content.categories
| Key | Type | Optionality | Description | Constraints |
|---|---|---|---|---|
dataset | string | REQUIRED | URL link to a dataset object representing the markers | /rest/projects/$projectId/md/datasets?name={datasetName} |
markers | array | REQUIRED | an array of marker objects | |
linkedLayers | array | OPTIONAL | an array of objects specifying layers linked to the marker category | |
itemId | string | REQUIRED | Generated ID for this item to be used for matching it within a parent array while rebasing share objects. For more details see content.**.itemId section. | [a-z0-9]{32} |
There are two rules surrounding marker selector categories to note:
- a dataset which has available data (e.g. your stores) is always displayed as the first category, instead of a dataset with no data (e.g. competitor stores)
- a dataset which is selected as a marker selector category is not available to be visualized as a dot map
content.categories.markers
| Key | Type | Optionality | Description | Constraints |
|---|---|---|---|---|
marker | string | REQUIRED | URI link to a marker object representing marker in a category | /rest/projects/$projectId/md/ |
visible | boolean | REQUIRED | sets the default visibility of the marker default = |
|
addOnExpand | boolean | OPTIONAL | specifies if the marker should become visible after clicking on the category, when by default it is set to | [true, false] |
itemId | string | REQUIRED | Generated ID for this item to be used for matching it within a parent array while rebasing share objects. For more details see content.**.itemId section. | [a-z0-9]{32} |
content.categories.linkedLayers
linkedLayersThe linkedLayers array contains layers that should be explicitly linked to markerSelector categories. They are represented by dwh datasets of geometryPolygon subtype, which are linked to their respective geometries defined by vt datasets.
The typcal use case is - the markers represent restaurants, and the linked layers are the restaurant's delivery zones.
| Key | Type | Optionality | Description | Constraints |
|---|---|---|---|---|
dataset | string | REQUIRED | URL link to a dataset object representing the linked layers | /rest/projects/$projectId/md/datasets?name={datasetName} |
style | array | OPTIONAL | specifies the style of the layer |
|
visible | boolean | OPTIONAL | sets the default visibility of the layer | [true, false] |
itemId | string | REQUIRED | Generated ID for this item to be used for matching it within a parent array while rebasing share objects. For more details see content.**.itemId section. | [a-z0-9]{32} |
content.granularityCategories.granularityCategory
| Key | Type | Optionality | Description | Constraints |
|---|---|---|---|---|
dataset | string | REQUIRED | URL link to a dataset object representing the linked granularities | /rest/projects/$projectId/md/datasets?name={datasetName} |
splitPropertyName | string | REQUIRED | dataset property, by which the marker will be filtered | {datasetProperty} |
styleType | string | REQUIRED | type of the visualization style | [color, pattern, weight] |
itemId | string | REQUIRED | Generated ID for this item to be used for matching it within a parent array while rebasing share objects. For more details see content.**.itemId section. | [a-z0-9]{32} |
content.keepFiltered
| Key | Type | Optionality | Description | Constraints |
|---|---|---|---|---|
granularity | boolean | REQUIRED | specifies if the filtered granularity objects (areas, lines...) should be visible when filtered | [true, false] |
markers | boolean | REQUIRED | specifies if the filtered markers should be visible when filtered | [true, false] |
content.**.itemId
Generated ID for this item to be used for matching it within a parent array while rebasing share objects. itemId is genrated as hash from random UUID when given item is being created - either an entire dashboard is being created or an item is being added to MD object content via update. Once itemId is generated it is not supposed to be modified.
IMPORTANT: When interacting with REST API do not provide own generated values as itemId;
- if an item is being created do not provide itemId attribute at all - it will be generated at backend and returend within a response payload
- if an item is being updated provide the value of itemId which was previously retrieved from backend via REST API - this value will be used for matching the item with share object diffs while rebasing a share object
Visual representation
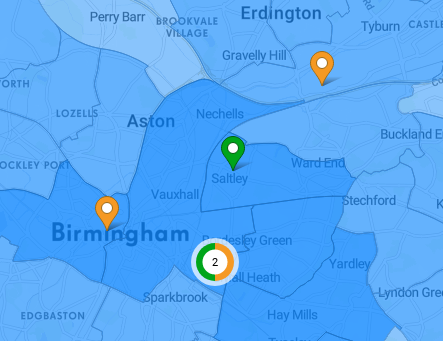
Marker selectors can be visualised as groups of markers. On this cutout, you can see 2 marker groups - orange and green, each represented by one marker selector.
You can manage the markers by clicking on the Visibility tool icon (![]() ) next to the Infopanel.
) next to the Infopanel.