| Table of Contents | ||
|---|---|---|
|
Introduction
What do I need to create a project in CleverMaps?
Technical prerequisites
There's a few technical prerequisites you'll need to fulfill:
- CleverMaps Shell (download, installation guide)
- which requires Java Development Kit version 8+ (recommended version 11 - download from Oracle)
- and also a CleverMaps account (register here)
- a good text editor
- CleverMaps Shell (download, installation guide)
Personal prerequisites
There is also a certain level of knowledge you need to have:
- knowledge of the CleverMaps application
- you can learn more in our Help center
- knowledge of the CleverMaps metadata model
- basic knowledge of the JSON text format
- not getting scared by a command line interface
- knowledge of the CleverMaps application
How much time will it cost me?
The time it will take you depends on your skills and your dedication to learn new things. But once you start to get a grip on it, you will be able to produce projects much faster.
What is CleverMaps Shell?
CleverMaps Shell is a command line interface tool designed for the management of the platform. It allows you to create and manage various aspects of a CleverMaps project.
You can learn more about it in its own section.
Data visualization
How to visualize my business data in the map?
There are two ways of visualizing data in the map:
 Using geospatial coordinates - latitude and longitude
Linking the data to a polygon, (usually an administrative unit) using an id of that polygon
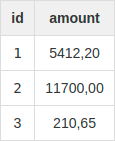
Let's have a look at an example. We have a table with a number of orders. Each order has an id and an amount.
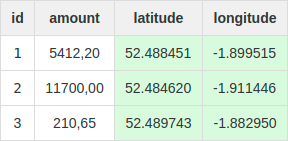
The order has been placed on a certain location on Earth. By adding a latitude and longitude of that location, we can visualize the orders in a map.
The order has also happened in some administrative unit of a state, e.g. a district. These districts have ids, by adding the id column to our orders table, and specifying the foreignKey attribute of the district_id property, we can visualize the orders in a map.
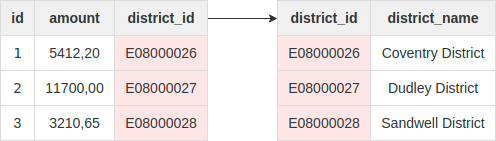
Please note that the districts have their polygon geometries also stored somewhere. This can be a separate table which is linked, to the district table.
How to determine the geographical coordinates or the administrative unit ids?
If your data does not contain latitude and longitude or administrative unit ids, they have to be geocoded. To do that, you need at least an address. The process is following:
1) Geocode the address to determine its latitude and longitude (using an external service, like OpenCage Geocoder)
2) Use CleverMaps AreaMapper utility to assign administrative unit ids to these coordinates
If you're not sure about this, we can geocode the data for you. Contact us at support@clevermaps.io.
What specification do dates datasets must meet?
Datasets which contains dates - for example order_date in case of Orders or registration_date in case of Customers are required to be in the ISO 8601 standard, without a time zone. Examples:
2020-08-05
2019-12-10
1970-01-01
How are points represented in CleverMaps?
Each point must have a latitude and longitude. That point then can be visualised by either a:
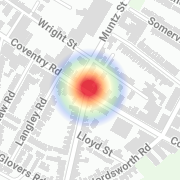
Please note that the heatmap's primary use is for visualization of a larger number of aggregated points.
What specification do point datasets must meet?
Datasets which contain points must have 2 columns named exactly "lat" and "lng" which contain the latitude and longitude.
How are areas represented in CleverMaps?
In CleverMaps, areas are represented by polygons. Unlike traditional geographic information systems, they are not represented directly by GeoJSON, or Shapefile. We use vector tiles served by an online service (Mapbox).
The polygon layer is represented by a vector tile dataset, and a dwh dataset of geometryPolygon type.
Can I upload my own polygons?
You can use our CleverMaps MapboxUtils utility to convert your geospatial data to Mapbox Vector Tiles and upload them to Mapbox.
If you have your geometries, but you don't want to prepare your own vector tiles, we can do it for you. Contact us at support@clevermaps.io.
Can I change the color of polygons?
There is a number of scales, which you can set your indicator to. Please note that this setting is indicator specific - you have to set the coloring of each indicator separately.
Custom polygon coloring is not available.
Can I change the color of dots?
There is a number of scales, which you can set your indicator to, just like polygons.
How do I use the heatmap visualization?
A heatmap is a visualisation of a number of points. Your data have to be represented by a geometryPoint dwh dataset. Then you have to enable the heatmap visualisation, in a visualizations attribute of a respective indicator.
How do I use the polygon visualization?
All geometryPolygon dwh datasets are visualised as polygons. This option does not have to be explicitly enabled in an indicator.
How do I use the point visualization?
All geometryPoint dwh datasets are visualised as points. This option does not have to be explicitly enabled in an indicator.
How can I change the unit of an indicator?
By specifying the content.format object of the respective indicator.
How can I change the coloring of an indicator?
By specifying the content.scale key of the respective indicator.
How can I drill down the indicator?
By adding an indicator drill, and connecting it to its respective indicator in the dashboard.
How do I add a filter?
Filters are defined in the view object. You can specify various kinds of filters in its content.filterGroup object.
Data upload
What data file types do you support?
We support only CSV files.
I have a specific CSV with custom separators, how can I upload it?
You can specify custom CSV settings in the respective parameters of loadCsv command.
I've just uploaded the data, why aren't they visible in the application?
CleverMaps is different than traditional geographic information systems. After you create a dataset and upload the data, you will still need to define how to visualize them, and define what metrics you will perform on the data. To be exact: you have to create a metric, an indicator, corresponding indicator drill, a dashboard and a view. This is covered in the first tutorial.
Can CleverMaps determine the data types of my tables?
Yes, using the createMetadata command and generating a dataset from a csv file.
You can find the list of avaialable data types here.
Where are my project dumps stored?
By default, the dump directories for each project are created in the directory from which you run the Shell .jar file.
However, you can specify your own directory in the config file.
Projects
Where can I see my projects?
All your projects are located on our production server - https://secure.clevermaps.io. You can list all your projects on the Project overview page.
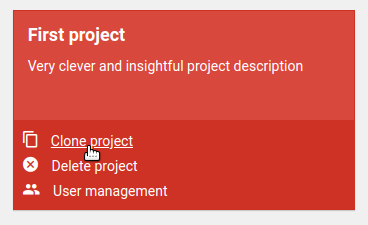
How do I clone a project?
There are two ways:
Using the Shell - see Shell project management tutorial.
Using the UI - hover the project card on the Project overview and select "Clone project"
Can I see the data model of my project?
The data model can be viewed in the application by hovering the Account icon on the bottom left of the Project page, and selecting Data model.
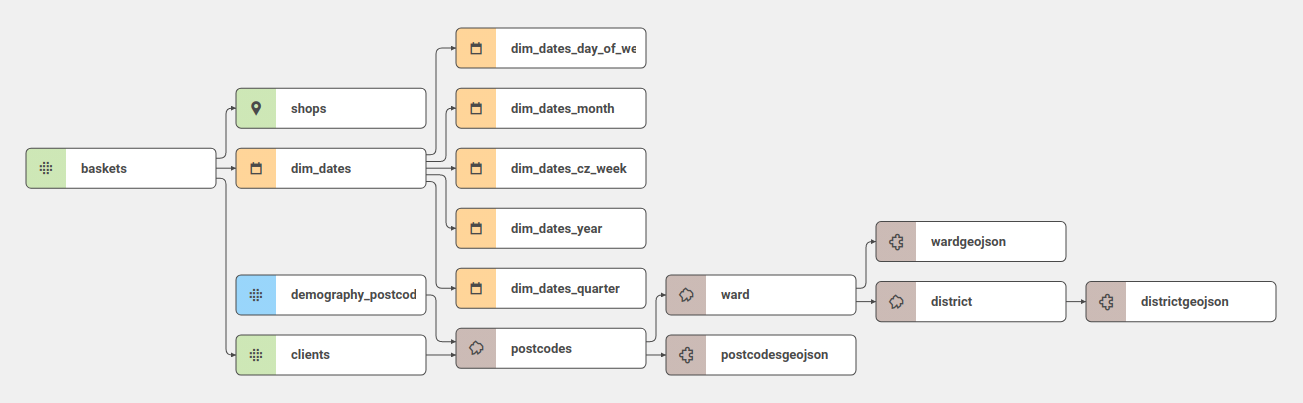
You can find out more about Data model in the Datasets and Tutorial 2: Data model and data dimensions articles.
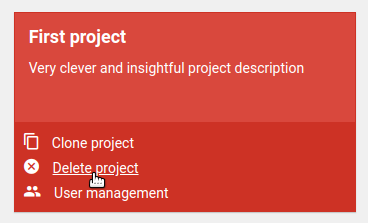
How do I delete a project?
There are two ways:
Using the deleteProject command in Shell - see Command list
Using the UI - hover the project card on the Project overview and select "Delete project"
Data dimensions
What are data dimensions?
Data dimensions are prepared projects that contain specific data (e.g. administrative units or demography). They can be imported into other projects and combined with their data.
What available data dimensions do you have?
You can view all available dimensions in the Data dimension projects article.
How do I import a data dimension into my project?
Once you have chosen the right dimension, you can import it to your project by using CleverMaps Shell. The guide to import a dimension is a part of the first tutorial.
Other
How should I understand the constraints in Key description of each metadata object?
The values of all keys of all metadata objects subject to various constraints. Their syntax is identified by a parenthesis type:
| Parenthesis | Description | Syntax example | Value example |
|---|---|---|---|
[ ] | Enumeration - a predefined set of valid values | [number, percentage] | "number" |
{ } | Metadata object reference - a reference to an existing metadata object or its properties | {datasetName}.{datasetProperty} | "clients.client_id" |
( ) | Regular expression - a pattern that the value must match | (a-z0-9_-) | "example-123" |