In this tutorial, we will explore various types of filters we can add to a view.
What you'll create
A group of 5 filters, each of different type and usage.
| Filters tool | globalDate filter |
|   |
Importing dates dimension
To be able to use one of the indicator drill blocks - timeSeries, we have to import the can-dim-dates dimension. You can do that using the importProject command.
This dimension contains datasets with dates, years, months etc. and is needed for any kind of filtering by date.
importProject --project tbagvahj2yvva9cx --server
To finish the import, use addMetadata to add all metadata files, and pushProject to upload the data.
Now we have to link the transactions dataset to the dimension. Find the date property of this dataset, and modify it so it contains foreignKey which points to the dim_dates dataset. The property should look like this:
	    ...
	{
	    "filterable": true,
	    "name": "date",
	    "title": "Date of the transaction",
	    "column": "date",
	    "type": "date",
	    "foreignKey": "dim_dates"
	},
	    ...
Use pushProject command to update transactions dataset in the project.
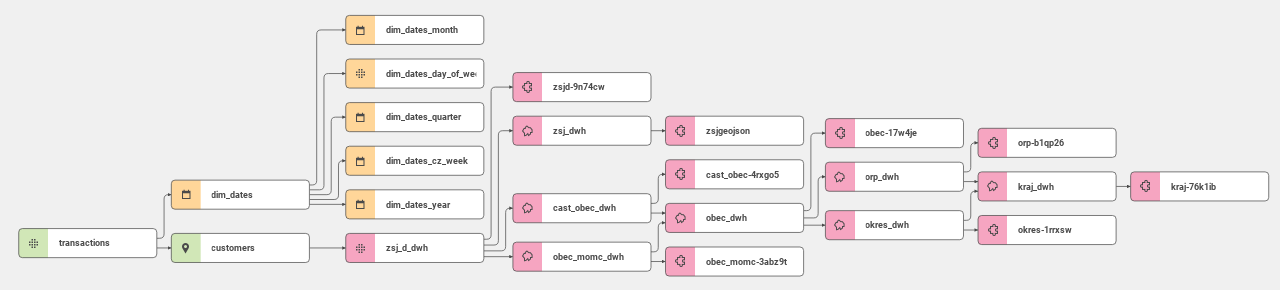
The data model should now look like this. You can see that the transactions dataset is connected to the dim_dates dataset.
Adding the globalDate filter
The globalDate filter controls the main time frame of a project's view. To use it, we need the can-dim-dates dimension we've imported earlier.
Let's add the filterGroup array with the globalDate filter on the transactions.date property to our view.
{
    "id": "oqkjjq275beecpu7",
    "name": "business_overview_view",
    "type": "view",
    "title": "Business overview",
    "description": "Overview of transactions and the location of your customer base.",
    "content": {
        "icon": "shopping_cart",
        "dashboard": "/rest/projects/$projectId/md/dashboards?name=business_overview_dashboard",
        "defaultGranularity": "/rest/projects/$projectId/md/datasets?name=zsj_dwh",
        "filterGroup": [
            {
                "type": "globalDate",
                "property": "transactions.date"
            }
        ],
        "mapOptions": {
            "center": {
                "lat": 49.203,
                "lng": 16.606
            },
            "zoom": 12,
            "tileLayer": "mapbox"
        }
    },
    "accessInfo": {
        "createdAt": "2020-06-29T13:49:07Z",
        "modifiedAt": "2020-06-30T08:13:53Z",
        "createdBy": "/rest/accounts/00ubfu7fdyIoFKxXm0h7",
        "modifiedBy": "/rest/accounts/00ubfu7fdyIoFKxXm0h7"
    },
    "links": [
        {
            "rel": "self",
            "href": "/rest/projects/k5t8mf2a80tay2ng/md/views/oqkjjq275beecpu7"
        }
    ]
}
Use pushProject command to update business_overview_view view in the project.
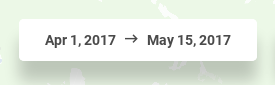
The globalDate filter is different from the other filters. This filter is not listed under the Filters tool icon (![]() ). Instead, it appears in the top right corner of the map window, next to the Filters tool icon (
). Instead, it appears in the top right corner of the map window, next to the Filters tool icon (![]() ).
).
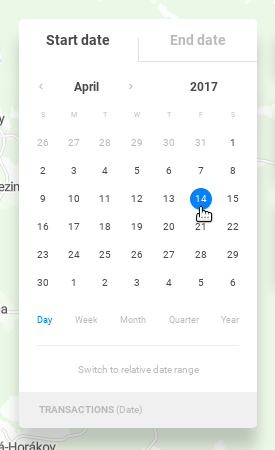
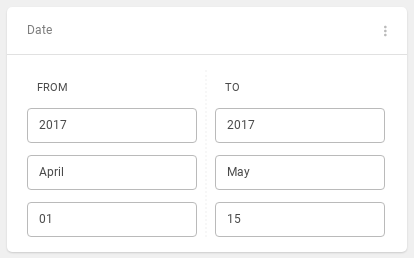
When you click on the filter, you will get a drop down menu with a calendar where you can select your own date range.
Adding the date filter
The date filter has identical syntax with the globalDate filter. Its purpose is to be able to filter additional date attributes. Our transactions dataset is simple, this filter would come to use if we had e.g. date of customer's registration.
{
    "id": "oqkjjq275beecpu7",
    "name": "business_overview_view",
    "type": "view",
    "title": "Business overview",
    "description": "Overview of transactions and the location of your customer base.",
    "content": {
        "icon": "shopping_cart",
        "dashboard": "/rest/projects/$projectId/md/dashboards?name=business_overview_dashboard",
        "defaultGranularity": "/rest/projects/$projectId/md/datasets?name=zsj_dwh",
        "filterGroup": [
            {
                "type": "globalDate",
                "property": "transactions.date"
            },
            {
                "type": "date",
                "property": "transactions.date"
            }
        ],
        "mapOptions": {
            "center": {
                "lat": 49.203,
                "lng": 16.606
            },
            "zoom": 12,
            "tileLayer": "mapbox"
        }
    },
    "accessInfo": {
        "createdAt": "2020-06-29T13:49:07Z",
        "modifiedAt": "2020-06-30T08:13:53Z",
        "createdBy": "/rest/accounts/00ubfu7fdyIoFKxXm0h7",
        "modifiedBy": "/rest/accounts/00ubfu7fdyIoFKxXm0h7"
    },
    "links": [
        {
            "rel": "self",
            "href": "/rest/projects/k5t8mf2a80tay2ng/md/views/oqkjjq275beecpu7"
        }
    ]
}
Use pushProject command to update business_overview_view view in the project.
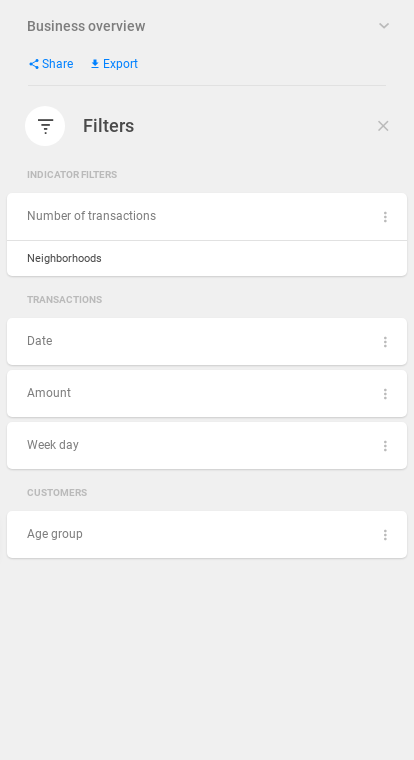
The date filter will now appear under the Filters tool icon (![]() ).
).
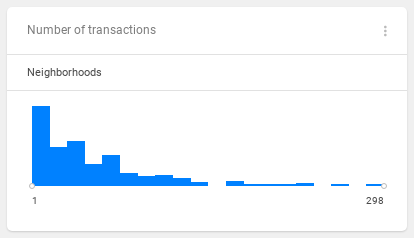
Adding the indicator filter
The indicator filter is used to filter areas based on computed values of indicators on selected granularity.
The usage is pretty straightforward - you specify URI reference to the indicator whose value you would like to filter. In this case, it is transactions_indicator from the first tutorial. Remember that the referenced indicator (and its metric) must be present in the project.
{
    "id": "oqkjjq275beecpu7",
    "name": "business_overview_view",
    "type": "view",
    "title": "Business overview",
    "description": "Overview of transactions and the location of your customer base.",
    "content": {
        "icon": "shopping_cart",
        "dashboard": "/rest/projects/$projectId/md/dashboards?name=business_overview_dashboard",
        "defaultGranularity": "/rest/projects/$projectId/md/datasets?name=zsj_dwh",
        "filterGroup": [
            {
                "type": "globalDate",
                "property": "transactions.date"
            },
            {
                "type": "date",
                "property": "transactions.date"
            },
            {
                "type": "indicator",
                "indicator": "/rest/projects/$projectId/md/indicators?name=transactions_indicator"
            }
        ],
        "mapOptions": {
            "center": {
                "lat": 49.203,
                "lng": 16.606
            },
            "zoom": 12,
            "tileLayer": "mapbox"
        }
    },
    "accessInfo": {
        "createdAt": "2020-06-29T13:49:07Z",
        "modifiedAt": "2020-06-30T08:13:53Z",
        "createdBy": "/rest/accounts/00ubfu7fdyIoFKxXm0h7",
        "modifiedBy": "/rest/accounts/00ubfu7fdyIoFKxXm0h7"
    },
    "links": [
        {
            "rel": "self",
            "href": "/rest/projects/k5t8mf2a80tay2ng/md/views/oqkjjq275beecpu7"
        }
    ]
}
Use pushProject command to update business_overview_view view in the project.
Note that the indicator filters have their own category in the Filters tool. They also allow you to specify the granularity on which they will be applied to.
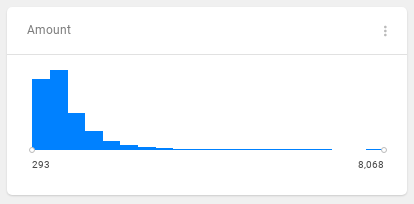
Adding the histogram filter
The histogram filter is used to filter integer or decimal values. We will add a filter on the amount property.
{
    "id": "oqkjjq275beecpu7",
    "name": "business_overview_view",
    "type": "view",
    "title": "Business overview",
    "description": "Overview of transactions and the location of your customer base.",
    "content": {
        "icon": "shopping_cart",
        "dashboard": "/rest/projects/$projectId/md/dashboards?name=business_overview_dashboard",
        "defaultGranularity": "/rest/projects/$projectId/md/datasets?name=zsj_dwh",
        "filterGroup": [
            {
                "type": "globalDate",
                "property": "transactions.date"
            },
            {
                "type": "date",
                "property": "transactions.date"
            },
            {
                "type": "indicator",
                "indicator": "/rest/projects/$projectId/md/indicators?name=transactions_indicator"
            },
            {
                "type": "histogram",
                "property": "transactions.amount",
                "format": {
                    "type": "number",
                    "fraction": 0,
                    "symbol": "CZK"
                }
            }
        ],
        "mapOptions": {
            "center": {
                "lat": 49.203,
                "lng": 16.606
            },
            "zoom": 12,
            "tileLayer": "mapbox"
        }
    },
    "accessInfo": {
        "createdAt": "2020-06-29T13:49:07Z",
        "modifiedAt": "2020-06-30T08:13:53Z",
        "createdBy": "/rest/accounts/00ubfu7fdyIoFKxXm0h7",
        "modifiedBy": "/rest/accounts/00ubfu7fdyIoFKxXm0h7"
    },
    "links": [
        {
            "rel": "self",
            "href": "/rest/projects/k5t8mf2a80tay2ng/md/views/oqkjjq275beecpu7"
        }
    ]
}
Use pushProject command to update business_overview_view view in the project.
This filter uses the same graph as indicator drill's distribution block. The difference is that this graph only has one segment and it can't be turned on/off.
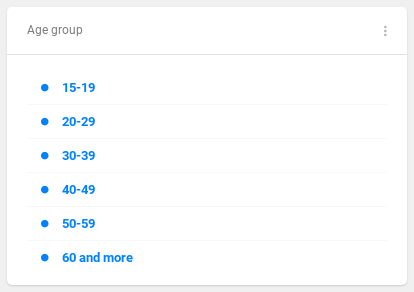
Adding the multiSelect filter
The multiSelect filter allows you to filter enumeration types, e.g. days of the week, customer sex, transaction type, etc.
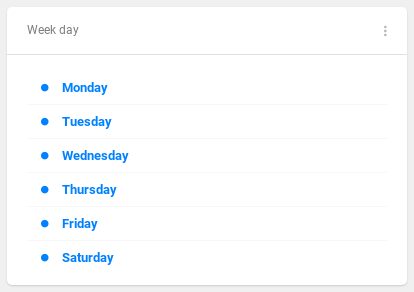
Let's add two multiSelect filters. The first one will filter the transactions.day_name property, which contains day names (Monday, Tuesday,... etc.) for each transaction. But since we want the day names to be correct order, we have to specify orderBy property - day_index which contains integer index of each day.
The second filter will filter the customers.age_group, which is in correct order by default, so we don't need an extra ordering property. But since this property filters the customers dataset, it will belong to the "Customers" section.
{
    "id": "oqkjjq275beecpu7",
    "name": "business_overview_view",
    "type": "view",
    "title": "Business overview",
    "description": "Overview of transactions and the location of your customer base.",
    "content": {
        "icon": "shopping_cart",
        "dashboard": "/rest/projects/$projectId/md/dashboards?name=business_overview_dashboard",
        "defaultGranularity": "/rest/projects/$projectId/md/datasets?name=zsj_dwh",
        "filterGroup": [
            {
                "type": "globalDate",
                "property": "transactions.date"
            },
            {
                "type": "date",
                "property": "transactions.date"
            },
            {
                "type": "indicator",
                "indicator": "/rest/projects/$projectId/md/indicators?name=transactions_indicator"
            },
            {
                "type": "histogram",
                "property": "transactions.amount",
                "format": {
                    "type": "number",
                    "fraction": 0,
                    "symbol": "CZK"
                }
            },
            {
                "type": "multiSelect",
                "property": "transactions.day_name",
                "orderBy": [
                    {
                        "property": "transactions.day_index",
                        "direction": "asc"
                    }
                ]
            },
            {
                "type": "multiSelect",
                "property": "customers.age_group"
            }
        ],
        "mapOptions": {
            "center": {
                "lat": 49.203,
                "lng": 16.606
            },
            "zoom": 12,
            "tileLayer": "mapbox"
        }
    },
    "accessInfo": {
        "createdAt": "2020-06-29T13:49:07Z",
        "modifiedAt": "2020-06-30T08:13:53Z",
        "createdBy": "/rest/accounts/00ubfu7fdyIoFKxXm0h7",
        "modifiedBy": "/rest/accounts/00ubfu7fdyIoFKxXm0h7"
    },
    "links": [
        {
            "rel": "self",
            "href": "/rest/projects/k5t8mf2a80tay2ng/md/views/oqkjjq275beecpu7"
        }
    ]
}
Use pushProject command to update business_overview_view view in the project.
transactions.day_name filter | customers.age_group filter |
|  |
Each filter offers a way to set its default values. This way, you can set up values which are applied before user enters the view.
There are also 2 more filters which are not covered in this tutorial - variables and singleSelect. More in this article.
![]() That's it! Feel free to add more filters on any properties you wish! In the next tutorial, we will take a look at indicator drill and its various types of blocks.
That's it! Feel free to add more filters on any properties you wish! In the next tutorial, we will take a look at indicator drill and its various types of blocks.